Open Access
Fig. 5.
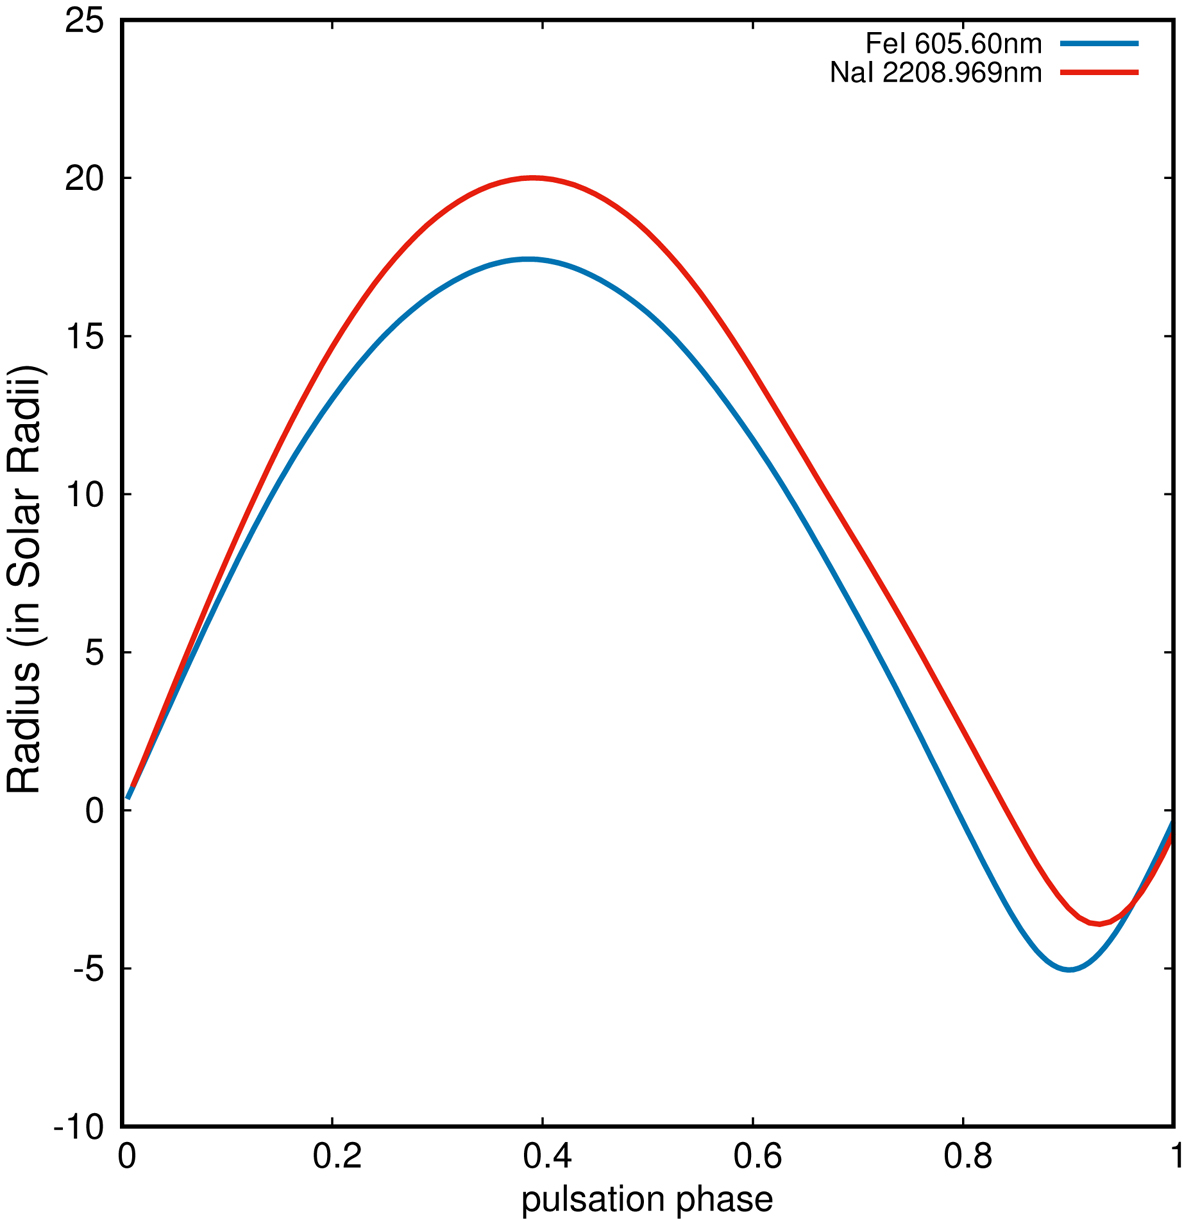
Interpolated radial velocity curves of Fig. 3 corrected from their respective velocity offsets and integrated with time in order to plot the radius variation associated with visible and infrared lines as a function of pulsation phase.
Current usage metrics show cumulative count of Article Views (full-text article views including HTML views, PDF and ePub downloads, according to the available data) and Abstracts Views on Vision4Press platform.
Data correspond to usage on the plateform after 2015. The current usage metrics is available 48-96 hours after online publication and is updated daily on week days.
Initial download of the metrics may take a while.