Fig. 1.
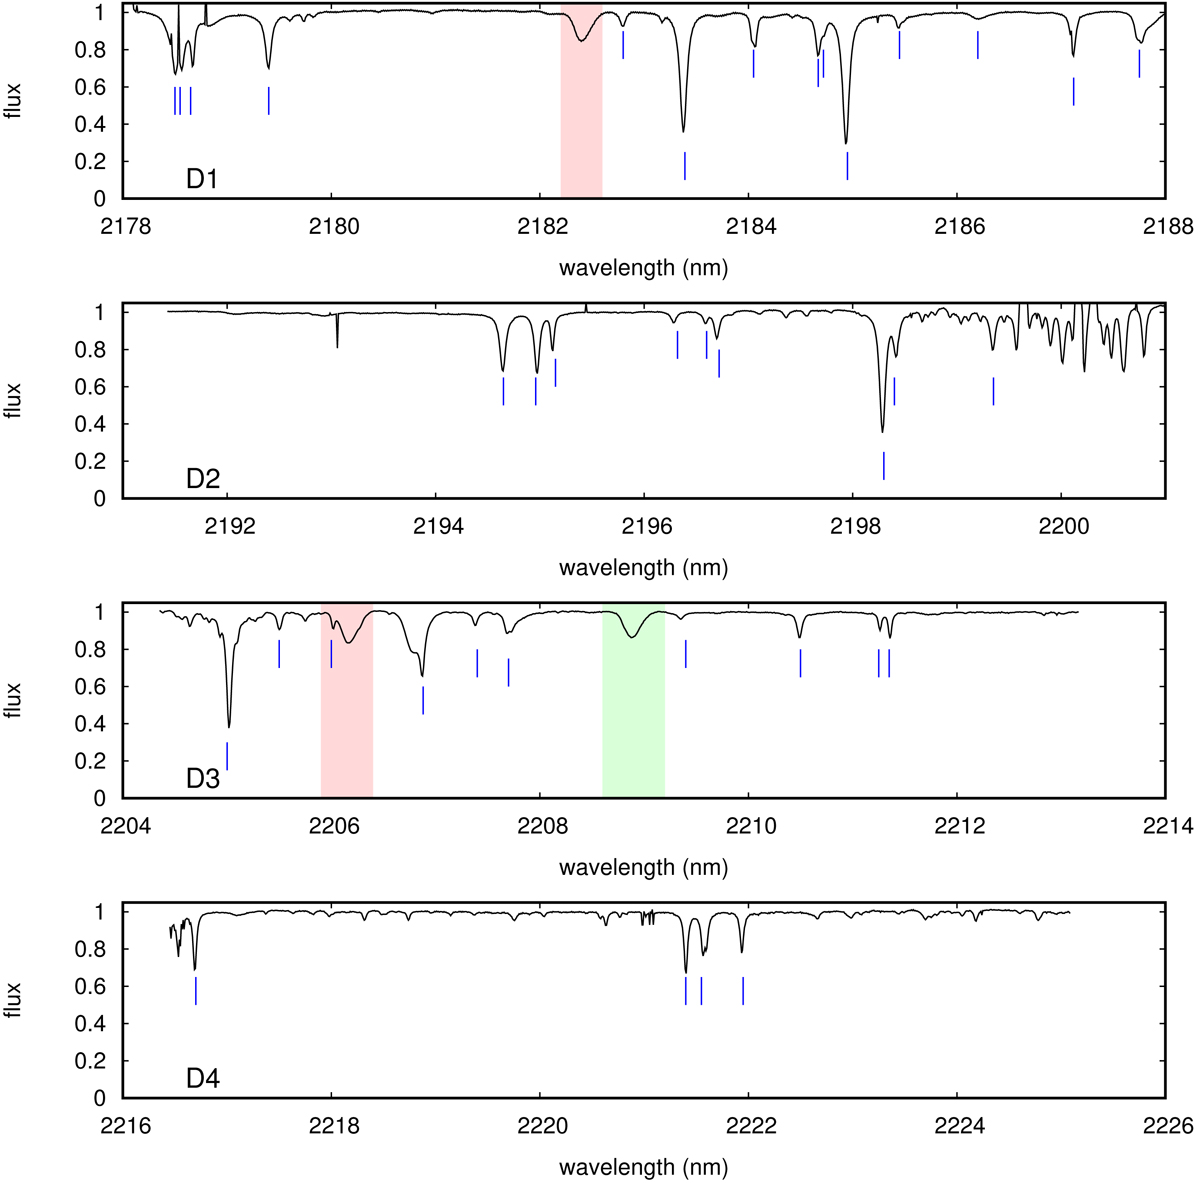
CRIRES spectra corresponding to phase 0.0 are plotted over the four detectors D1–D4. The blue vertical features indicate the telluric lines as identified with the Molecfit ESO sky modeling tool. The atmospheric line indicated on D1 by a red region is blended between phase 0.6–1.0. The NaI doublet appears in D3: the first component (2206.242 nm, red region) is blended, while the second (2208.969 nm, green region) is analyzed in this paper.
Current usage metrics show cumulative count of Article Views (full-text article views including HTML views, PDF and ePub downloads, according to the available data) and Abstracts Views on Vision4Press platform.
Data correspond to usage on the plateform after 2015. The current usage metrics is available 48-96 hours after online publication and is updated daily on week days.
Initial download of the metrics may take a while.