Open Access
Fig. A.1.
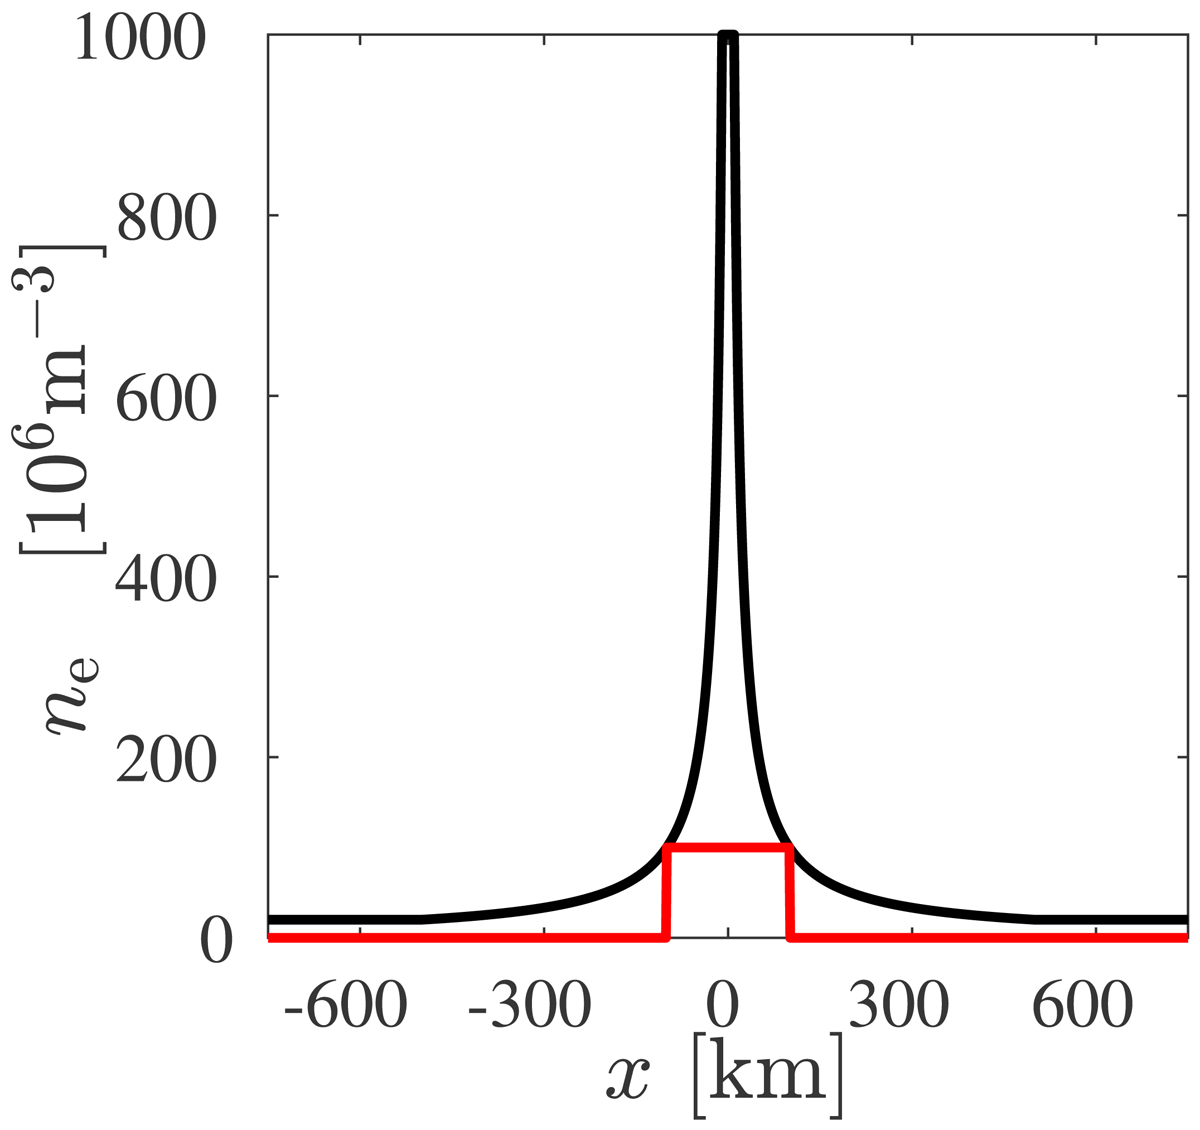
Plasma density along the x-axis in two different density models. The red curve shows a plasma with a uniform density n0 within a cylinder of radius R0, and the black curve shows a plasma with a density given by Eq. (A.3).
Current usage metrics show cumulative count of Article Views (full-text article views including HTML views, PDF and ePub downloads, according to the available data) and Abstracts Views on Vision4Press platform.
Data correspond to usage on the plateform after 2015. The current usage metrics is available 48-96 hours after online publication and is updated daily on week days.
Initial download of the metrics may take a while.