Fig. 7.
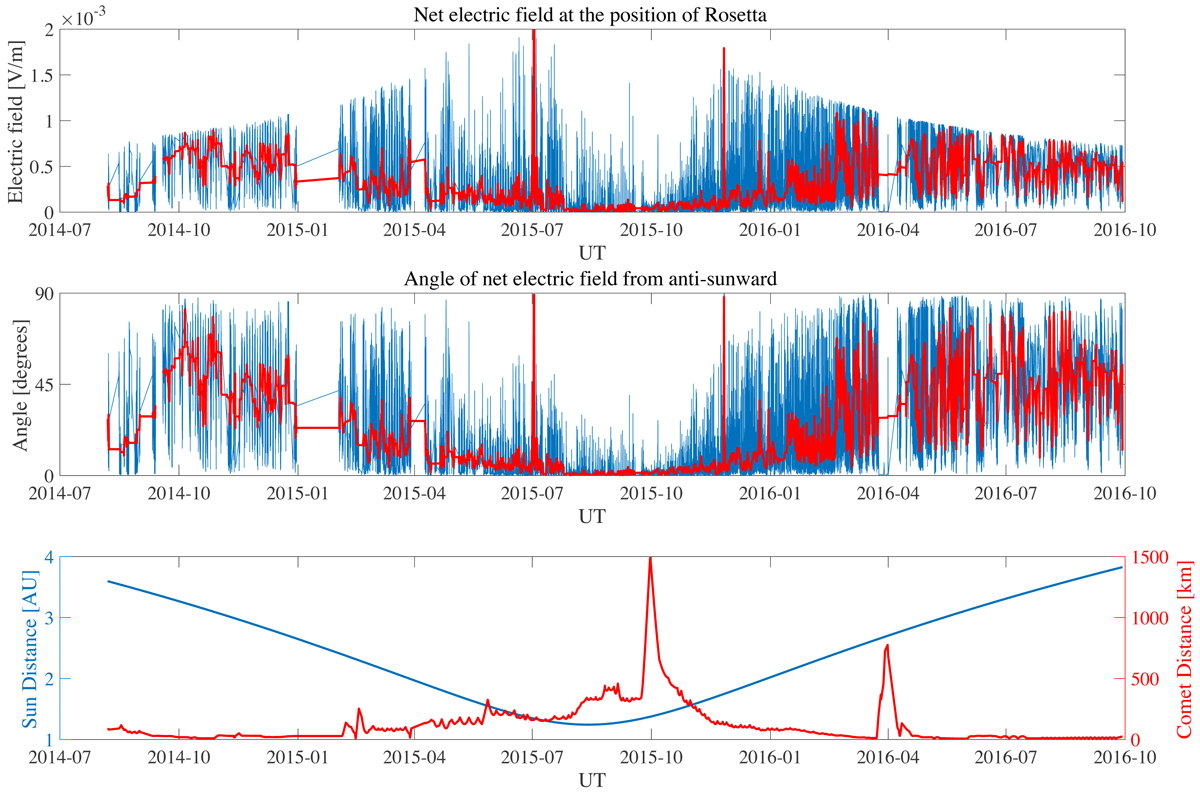
Model electric field based on observations and an assumed solar wind electric field. Blue lines show the model results; red lines show a 1000 data points running mean of the same data. Upper panel: magnitude of the model electric field. Middle panel: angle of the net model electric field from anti-sunward. Lower panel: Sun distance [AU] as a blue line, scale to the left, cometocentric distance [km] as a red line, scale to the right.
Current usage metrics show cumulative count of Article Views (full-text article views including HTML views, PDF and ePub downloads, according to the available data) and Abstracts Views on Vision4Press platform.
Data correspond to usage on the plateform after 2015. The current usage metrics is available 48-96 hours after online publication and is updated daily on week days.
Initial download of the metrics may take a while.