Fig. 5.
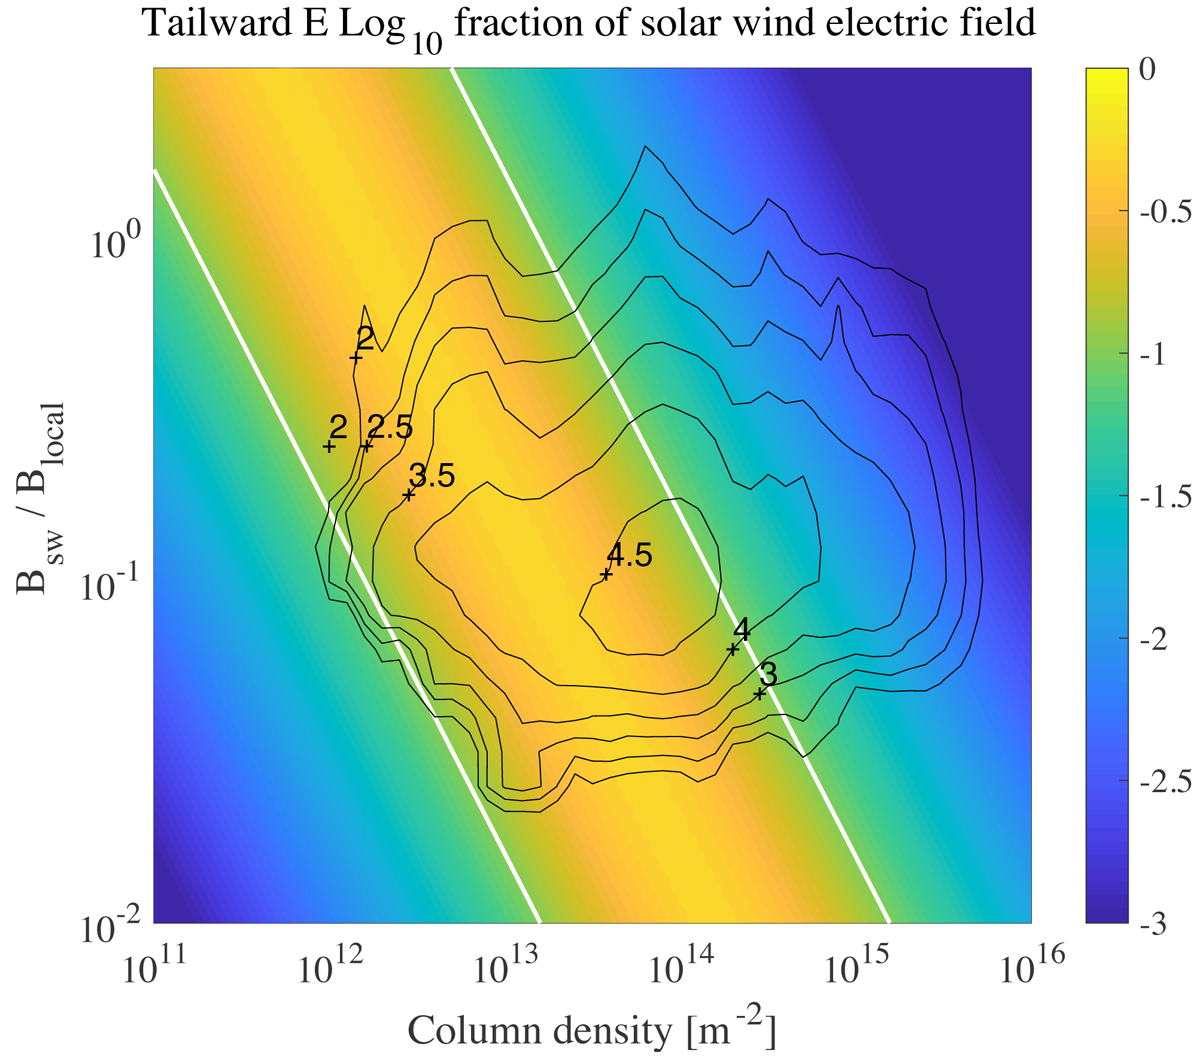
Tailward polarisation electric field as a log10 fraction of the solar wind electric field (colour scale) as a function of the column ion density [m−2] and the ratio of the solar wind to comet magnetic field strength. Black contour lines indicate the log10 number of data points to fall into the corresponding parameter space. We use density estimates obtained by the MIP instrument. White lines indicate the limits where the tailward electric field is 10% of the solar wind electric field.
Current usage metrics show cumulative count of Article Views (full-text article views including HTML views, PDF and ePub downloads, according to the available data) and Abstracts Views on Vision4Press platform.
Data correspond to usage on the plateform after 2015. The current usage metrics is available 48-96 hours after online publication and is updated daily on week days.
Initial download of the metrics may take a while.