Fig. 8.
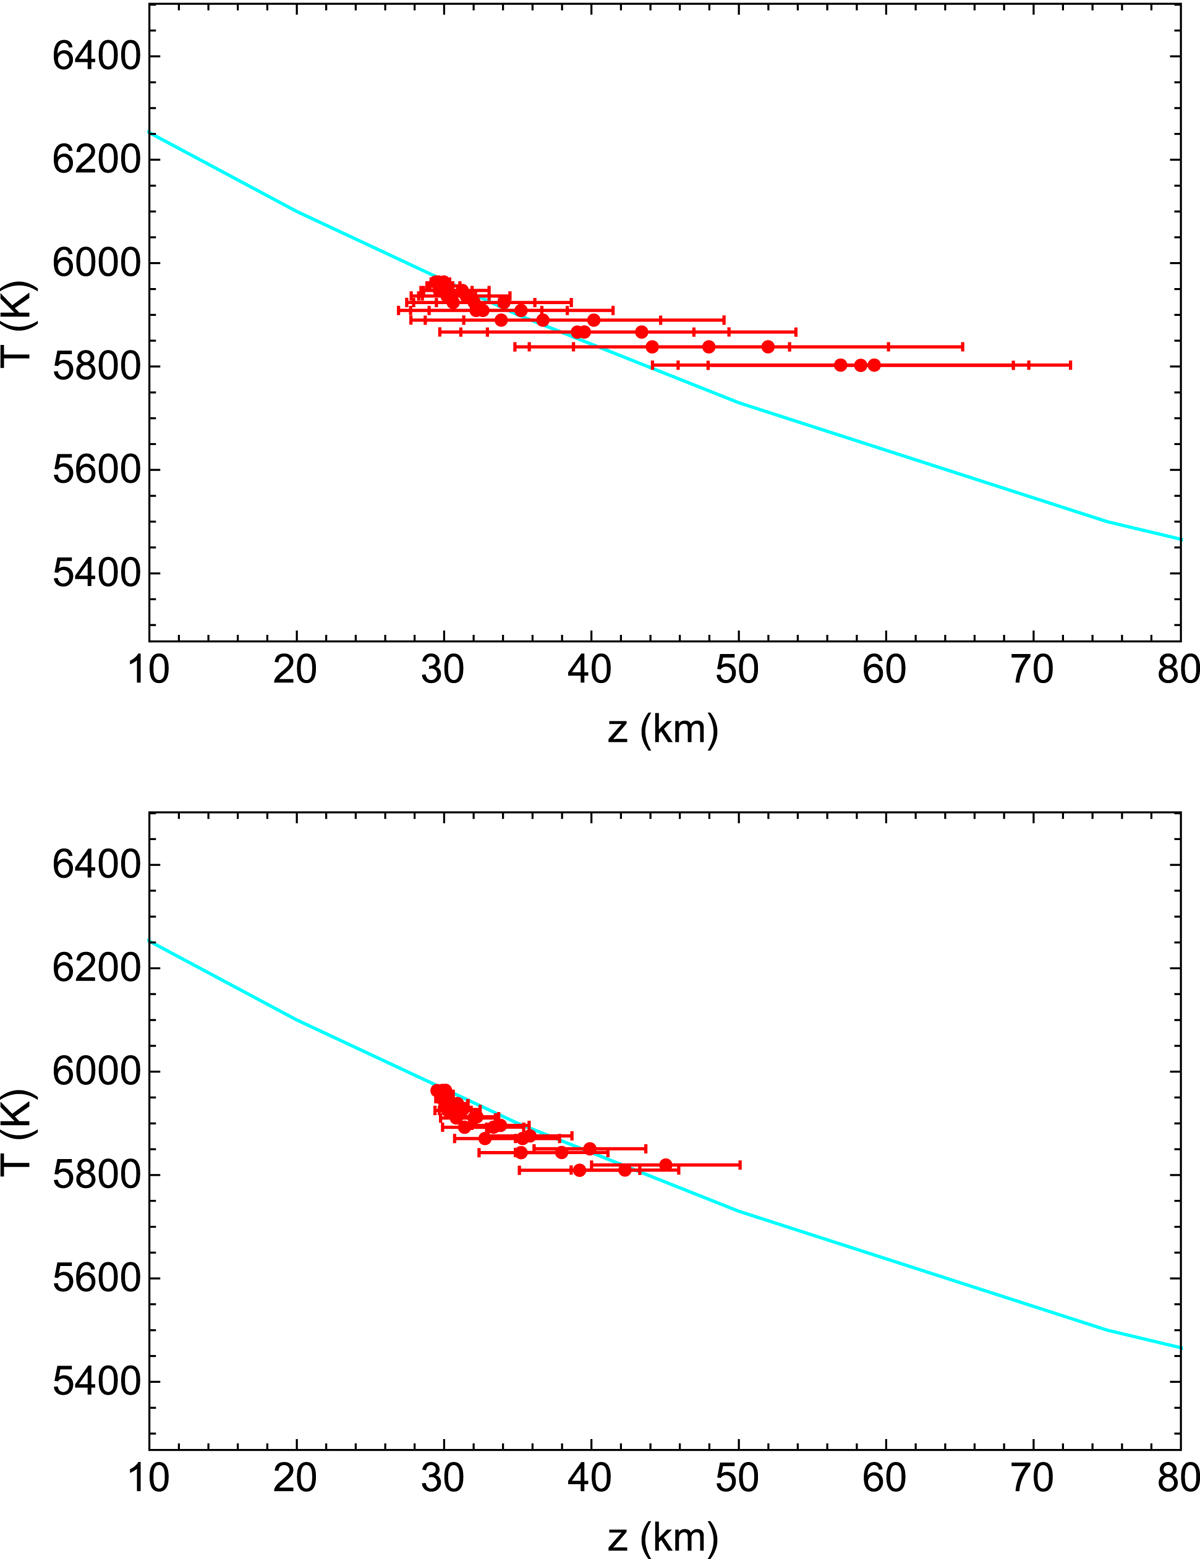
Temperature as a function of altitude for three snapshots of the RH simulation. The bars show one standard deviation on the measurement of the altitude. The blue curve shows the model 101 of Fontenla et al. (2011). Upper panel: measurements from perturbed images with r0 = 7 cm. Lower panel: measurements from images corrected with the AO system.
Current usage metrics show cumulative count of Article Views (full-text article views including HTML views, PDF and ePub downloads, according to the available data) and Abstracts Views on Vision4Press platform.
Data correspond to usage on the plateform after 2015. The current usage metrics is available 48-96 hours after online publication and is updated daily on week days.
Initial download of the metrics may take a while.