Free Access
Fig. 7.
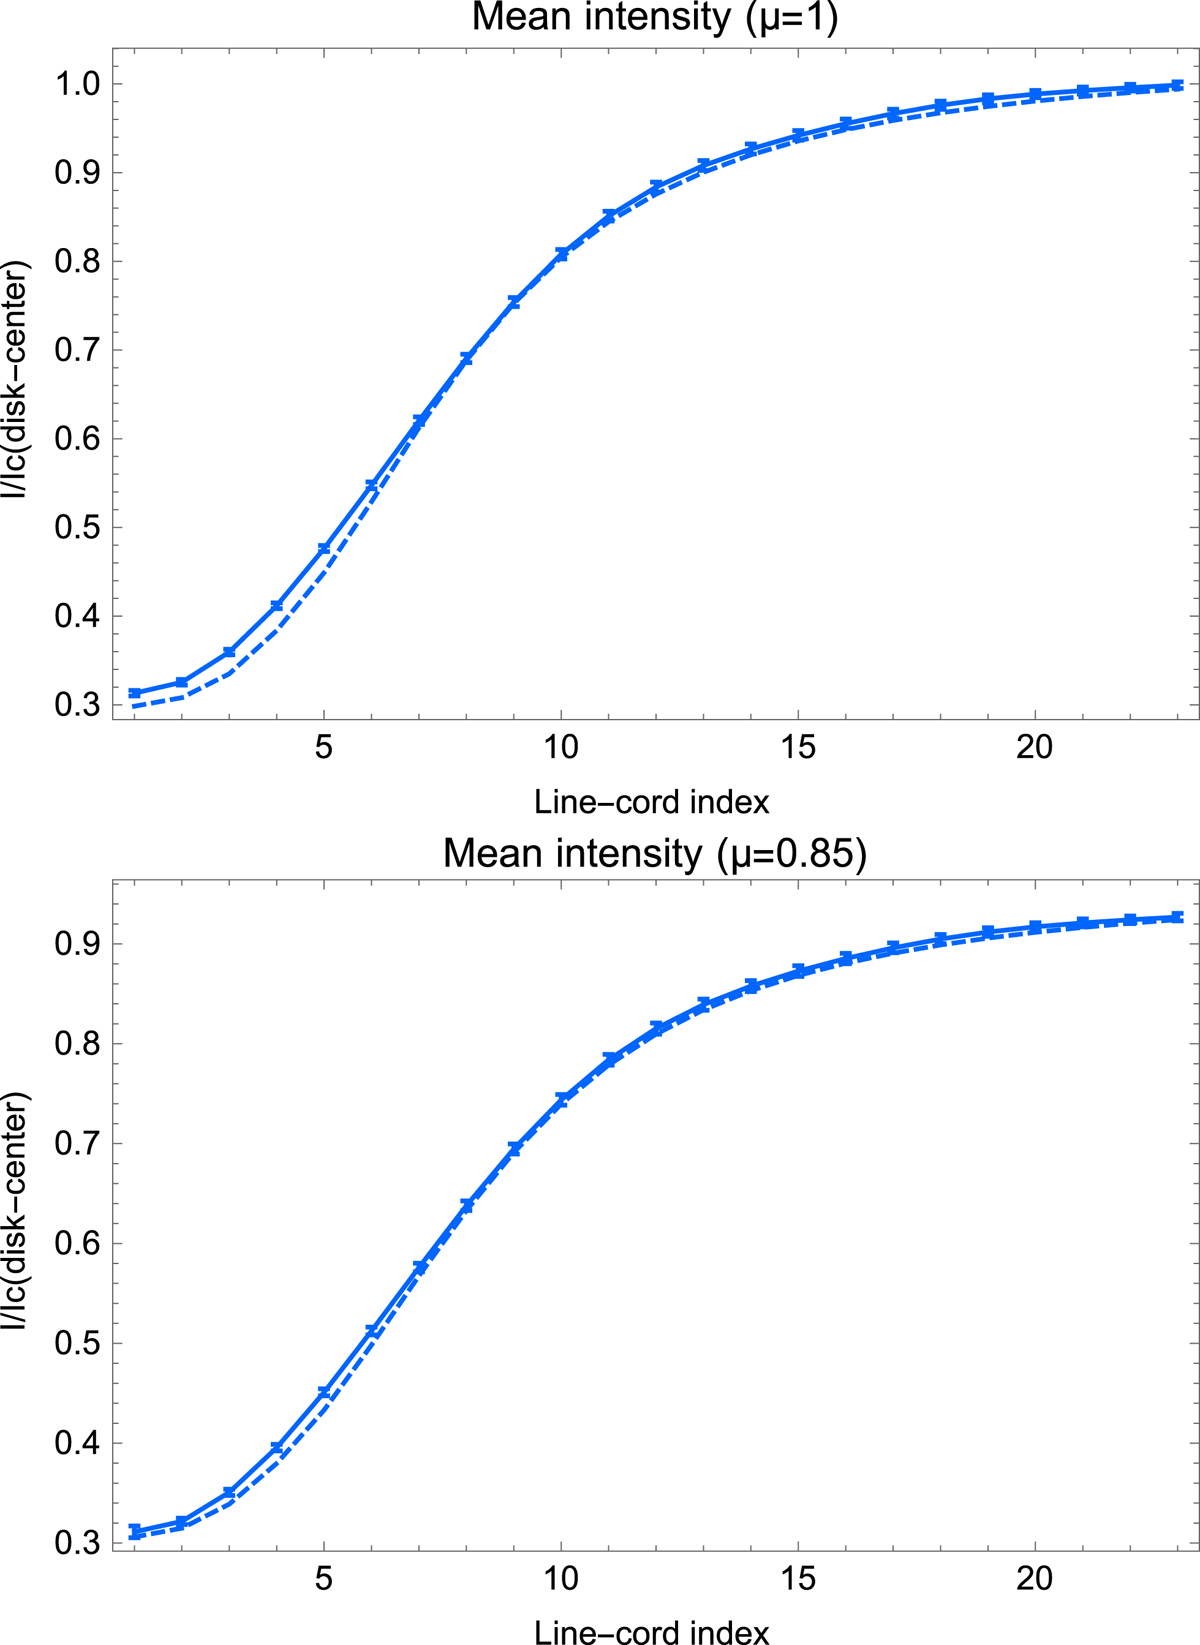
Intensity averaged on a 10″ × 10″ region of the quiet Sun at the 25 line levels normalized to the average continuum intensity at disk center. Dashed line: simulations. Full lines: hinode data. Upper panel: at solar disk-center. Lower panel: at cos ø = 0.85
Current usage metrics show cumulative count of Article Views (full-text article views including HTML views, PDF and ePub downloads, according to the available data) and Abstracts Views on Vision4Press platform.
Data correspond to usage on the plateform after 2015. The current usage metrics is available 48-96 hours after online publication and is updated daily on week days.
Initial download of the metrics may take a while.