Free Access
Fig. 6.
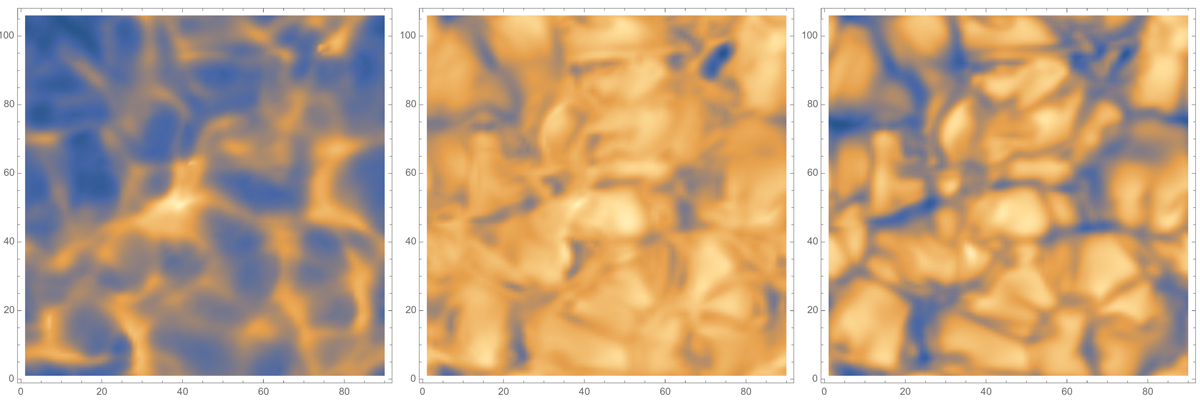
Images at different line levels. The image degradation due to the atmospheric turbulence r0 = 7 cm is corrected by the AO system described in the text. Left panel: line level 1 (line core). Middle panel: line level 8 (granulation-contrast inversion zone). Right panel: line level 15 close to the continuum.
Current usage metrics show cumulative count of Article Views (full-text article views including HTML views, PDF and ePub downloads, according to the available data) and Abstracts Views on Vision4Press platform.
Data correspond to usage on the plateform after 2015. The current usage metrics is available 48-96 hours after online publication and is updated daily on week days.
Initial download of the metrics may take a while.