Free Access
Fig. 5.
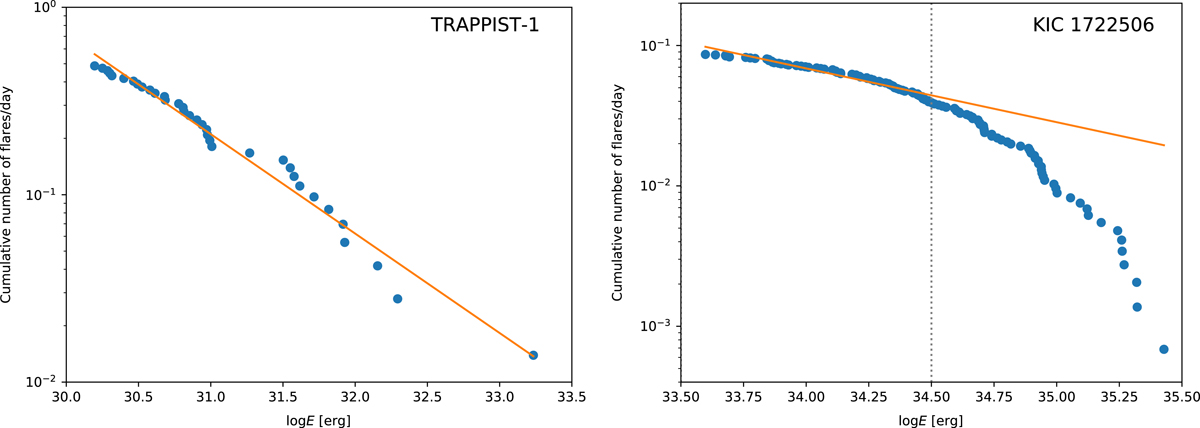
Cumulative flare frequency distribution as a function flare energy, log E where E is given in ergs, of the TRAPPIST-1 K2 data (left, cf. Vida et al. 2017) and for long-cadence Kepler data of KIC 1722506 (right). In the right plot, the dashed line marks the upper energy limit used for the fit.
Current usage metrics show cumulative count of Article Views (full-text article views including HTML views, PDF and ePub downloads, according to the available data) and Abstracts Views on Vision4Press platform.
Data correspond to usage on the plateform after 2015. The current usage metrics is available 48-96 hours after online publication and is updated daily on week days.
Initial download of the metrics may take a while.