Fig. 2.
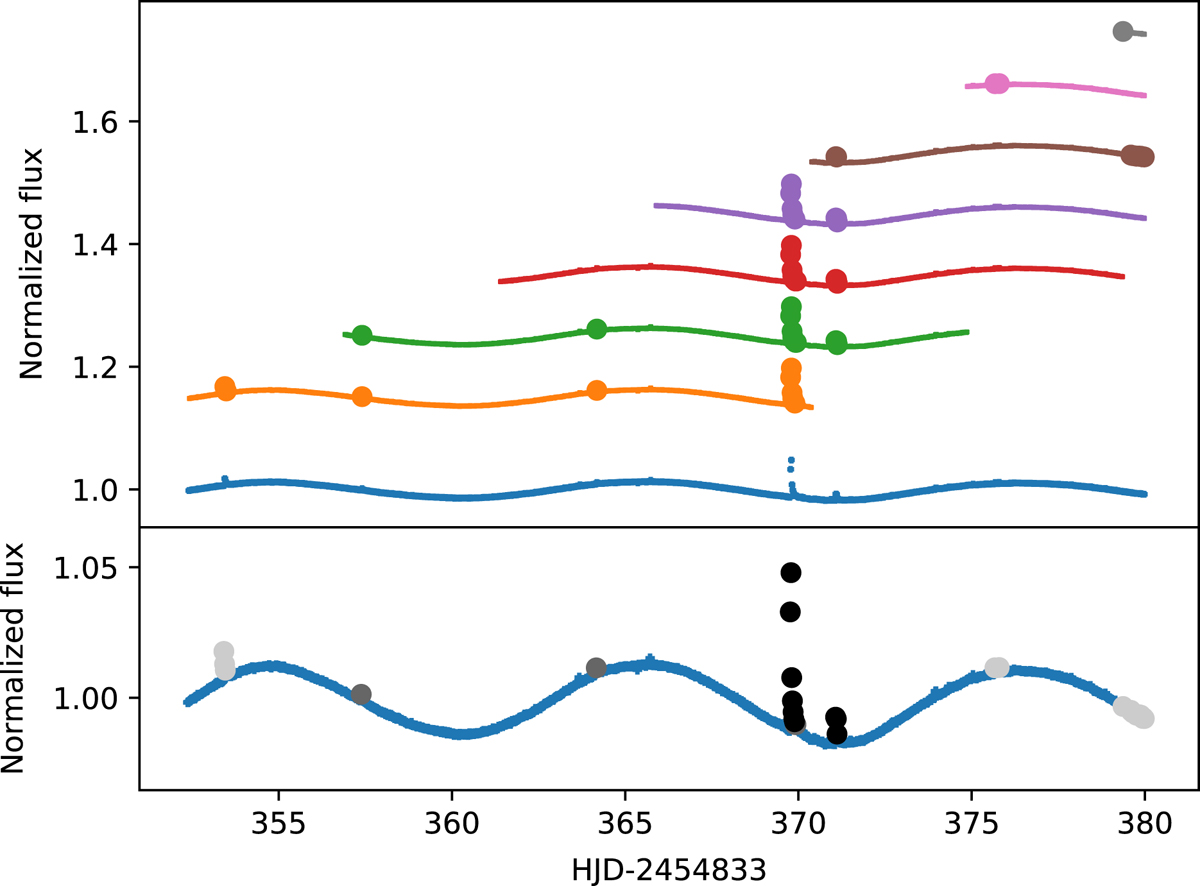
Demonstration of the voting algorithm on a light-curve section of KIC 1722506. The top plot shows the original light curve (in blue, near a normalized flux of 1), and each light-curve segment in individual windows tested by FLATW’RM (each a different color), and the flare candidates are marked for the given run with circles. In the bottom plot, the candidates with one (light gray), two (medium gray), and at least three (black) votes are plotted. In this setup, the flares plotted in black are kept as final flare candidates.
Current usage metrics show cumulative count of Article Views (full-text article views including HTML views, PDF and ePub downloads, according to the available data) and Abstracts Views on Vision4Press platform.
Data correspond to usage on the plateform after 2015. The current usage metrics is available 48-96 hours after online publication and is updated daily on week days.
Initial download of the metrics may take a while.