Fig. 1.
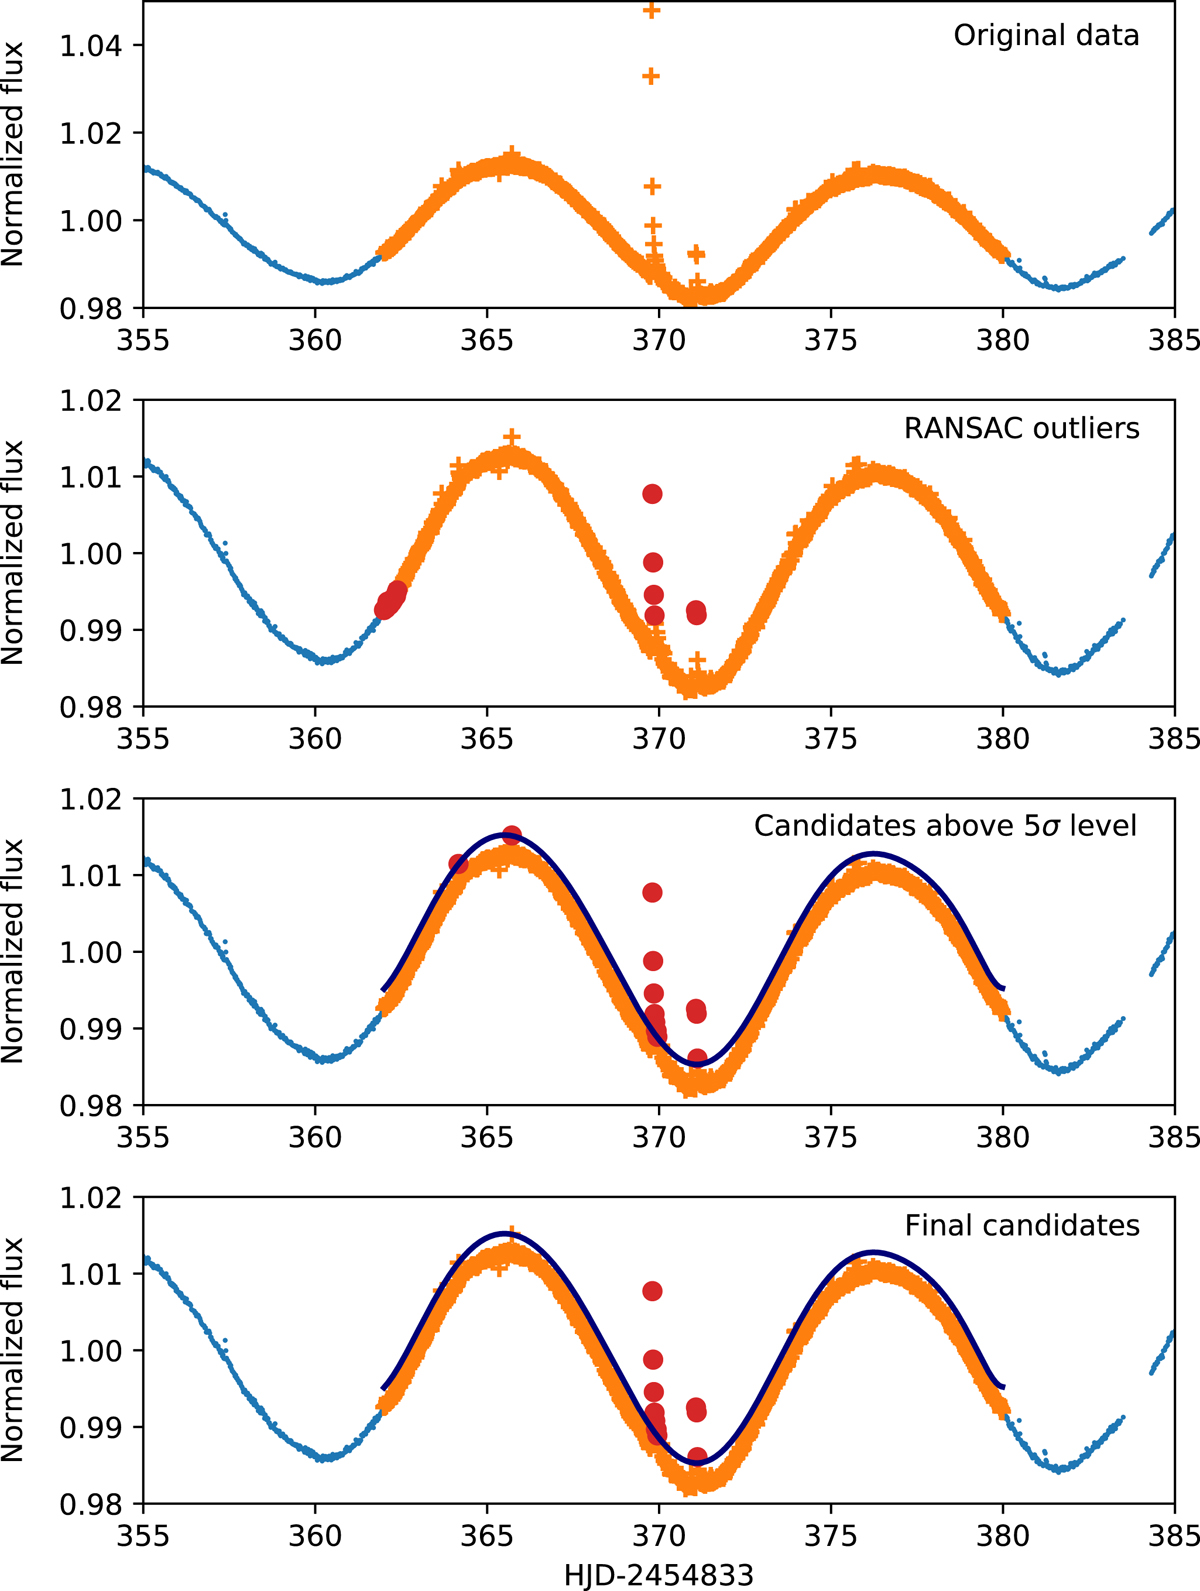
Demonstration of the algorithm on a light-curve section of KIC 1722506. The top plot shows the original light-curve section. The second plot shows the outlier points found by RANSAC, marked with red dots. The third plot shows the 5σ detection level from the fit (continuous line) and the flare candidate points. In the bottom plot, the final flare candidates are shown, which have more than a given number (three, in this case) of consecutive data points. These points will get a vote for this light-curve section, indicating that the feature likely is a flare.
Current usage metrics show cumulative count of Article Views (full-text article views including HTML views, PDF and ePub downloads, according to the available data) and Abstracts Views on Vision4Press platform.
Data correspond to usage on the plateform after 2015. The current usage metrics is available 48-96 hours after online publication and is updated daily on week days.
Initial download of the metrics may take a while.