Fig. 4
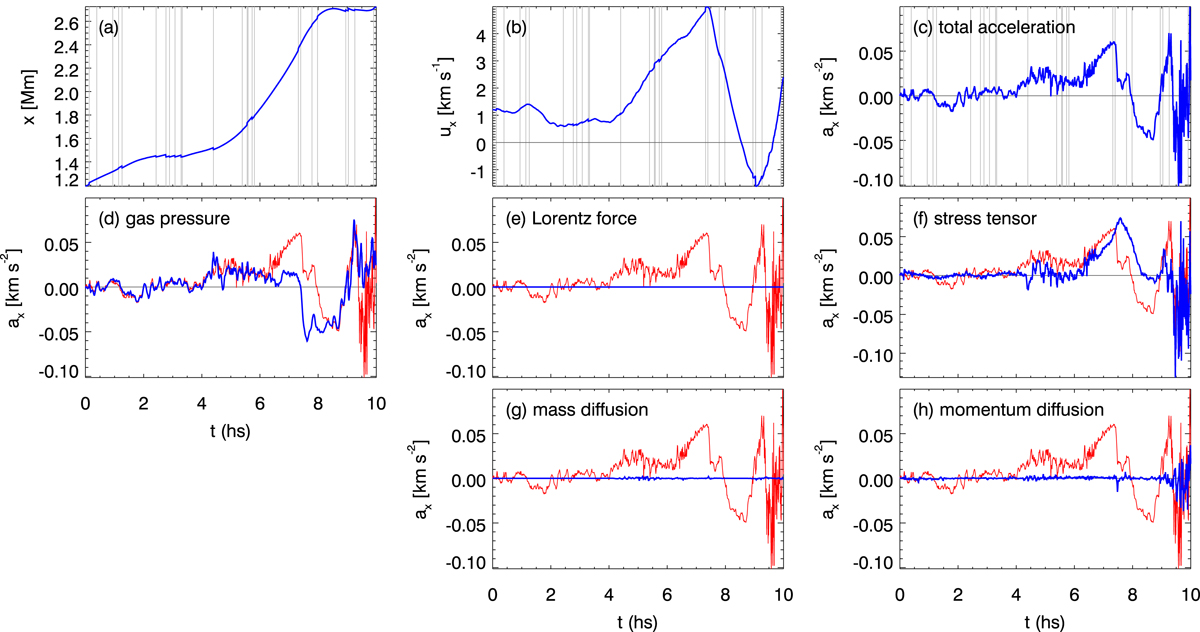
Coordinate, speed, acceleration, and forces acting in the x-direction on a fluid parcel in the convection zone as a function of time. Panels a, b, and c show the coordinate, speed, and acceleration. The thin vertical lines indicate the times where a different cork is used to trace the pathline. Panels d–h show the various forces in the simulation (blue) in comparison to the total acceleration (red). Panels g and h together make up the artificial diffusion term Bdiff in Eq. (4).
Current usage metrics show cumulative count of Article Views (full-text article views including HTML views, PDF and ePub downloads, according to the available data) and Abstracts Views on Vision4Press platform.
Data correspond to usage on the plateform after 2015. The current usage metrics is available 48-96 hours after online publication and is updated daily on week days.
Initial download of the metrics may take a while.