Fig. 3.
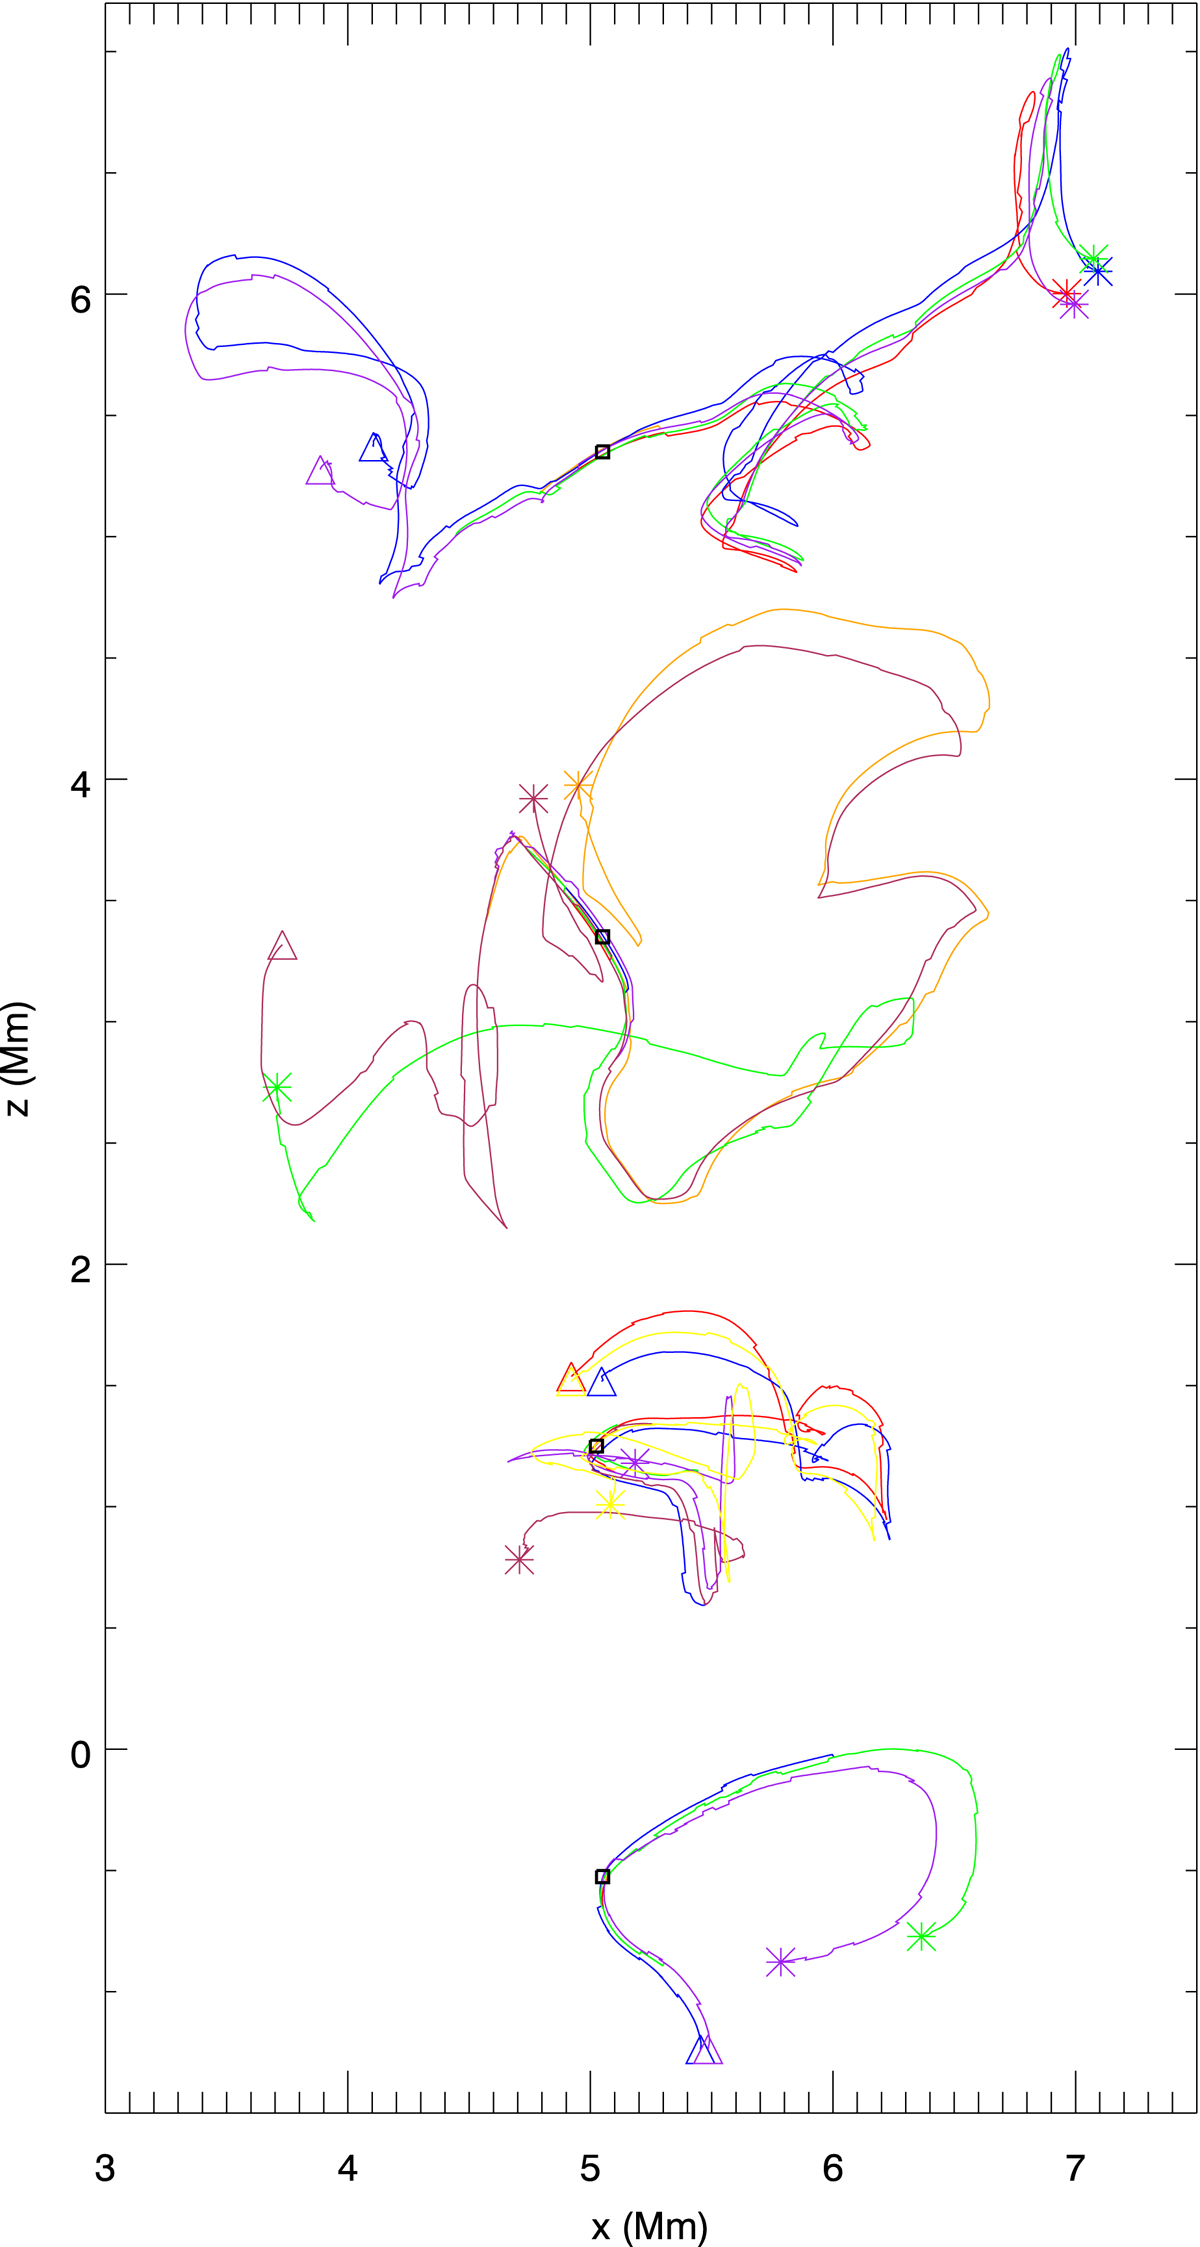
Pathlines of closely spaced gas parcels. The coloured curves indicate individual pathlines, starting at t = 0 s at the triangle, and ending at t = 1000 s at the asterix. The pathlines are constructed from seed points at t = 500 s located in the small black squares that have have a side length of 50 km, and are grouped into four areas. From top to bottom: corona, transition region, chromosphere, and convection zone.
Current usage metrics show cumulative count of Article Views (full-text article views including HTML views, PDF and ePub downloads, according to the available data) and Abstracts Views on Vision4Press platform.
Data correspond to usage on the plateform after 2015. The current usage metrics is available 48-96 hours after online publication and is updated daily on week days.
Initial download of the metrics may take a while.