Fig. 6.
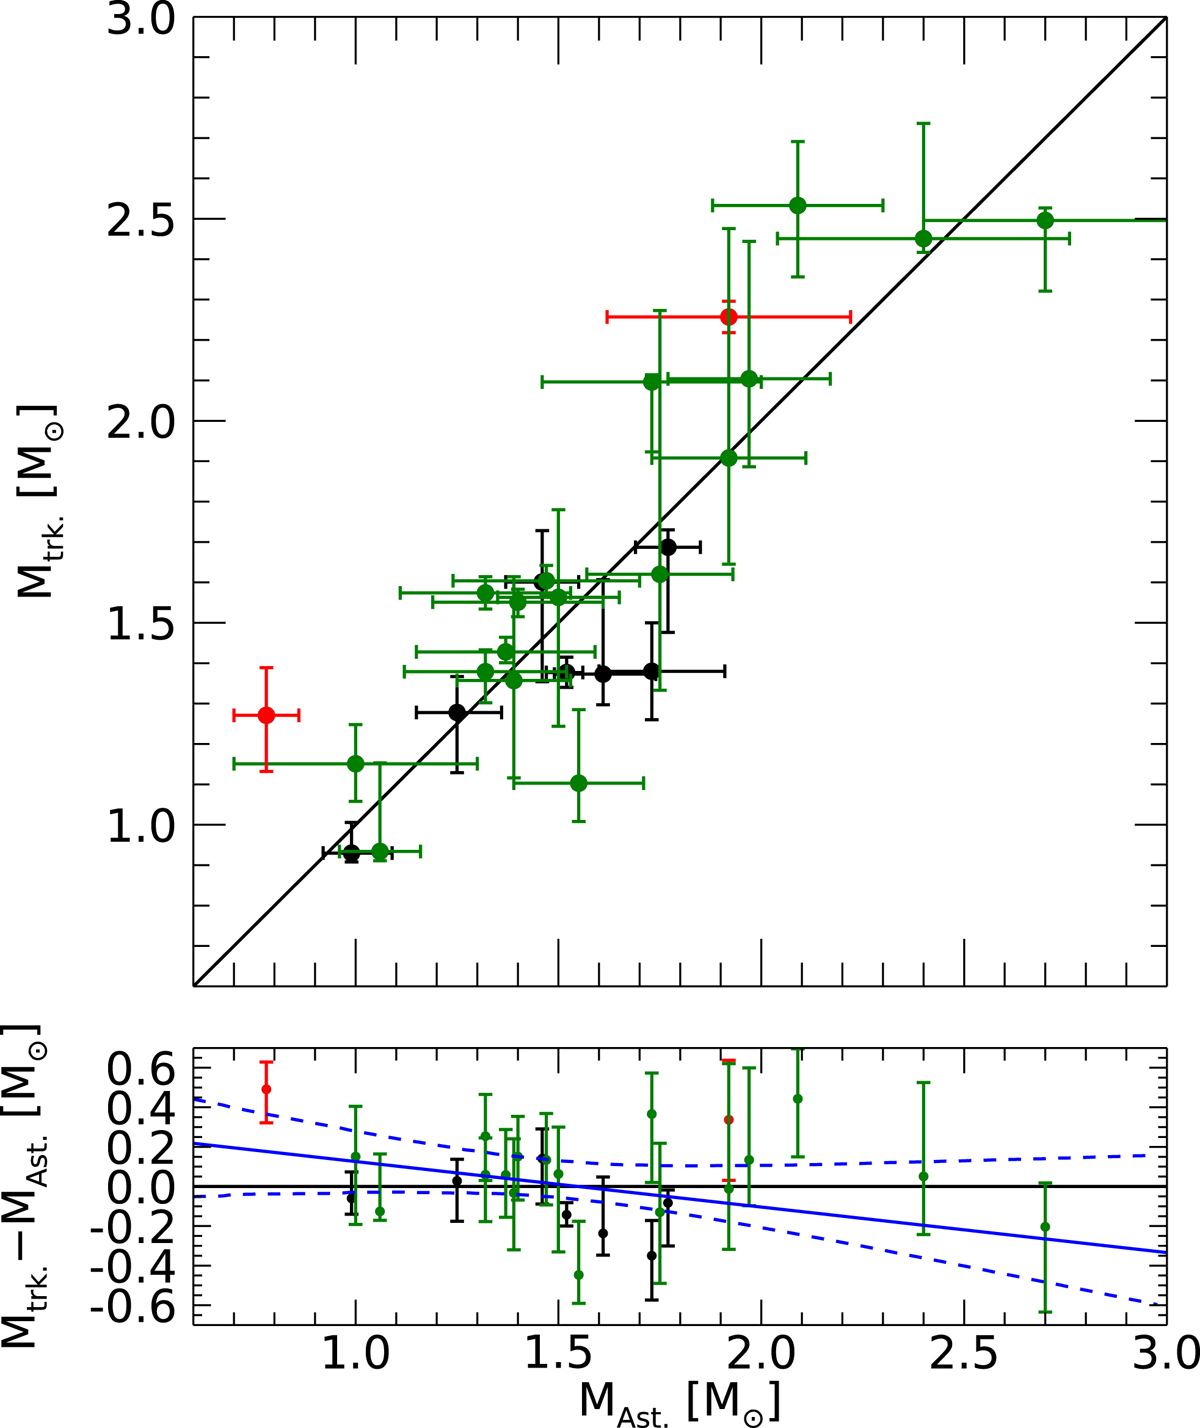
Upper panel: stellar masses of 26 giant stars that were determined from evolutionary tracks using our Bayesian methodology compared to asteroseismic reference masses. The black solid line marks the line of equality. Lower panel: difference of both masses as a function of the asteroseismic reference mass. Errors of the asteroseismic masses are not plotted for clarity in the lower panel, but are indicated in the upper panel. The blue solid line in the lower panel is a linear fit, where the errors in the asteroseismic masses have been taken fully into account. The blue dashed lines indicate the 95% confidence band.
Current usage metrics show cumulative count of Article Views (full-text article views including HTML views, PDF and ePub downloads, according to the available data) and Abstracts Views on Vision4Press platform.
Data correspond to usage on the plateform after 2015. The current usage metrics is available 48-96 hours after online publication and is updated daily on week days.
Initial download of the metrics may take a while.