Fig. 5.
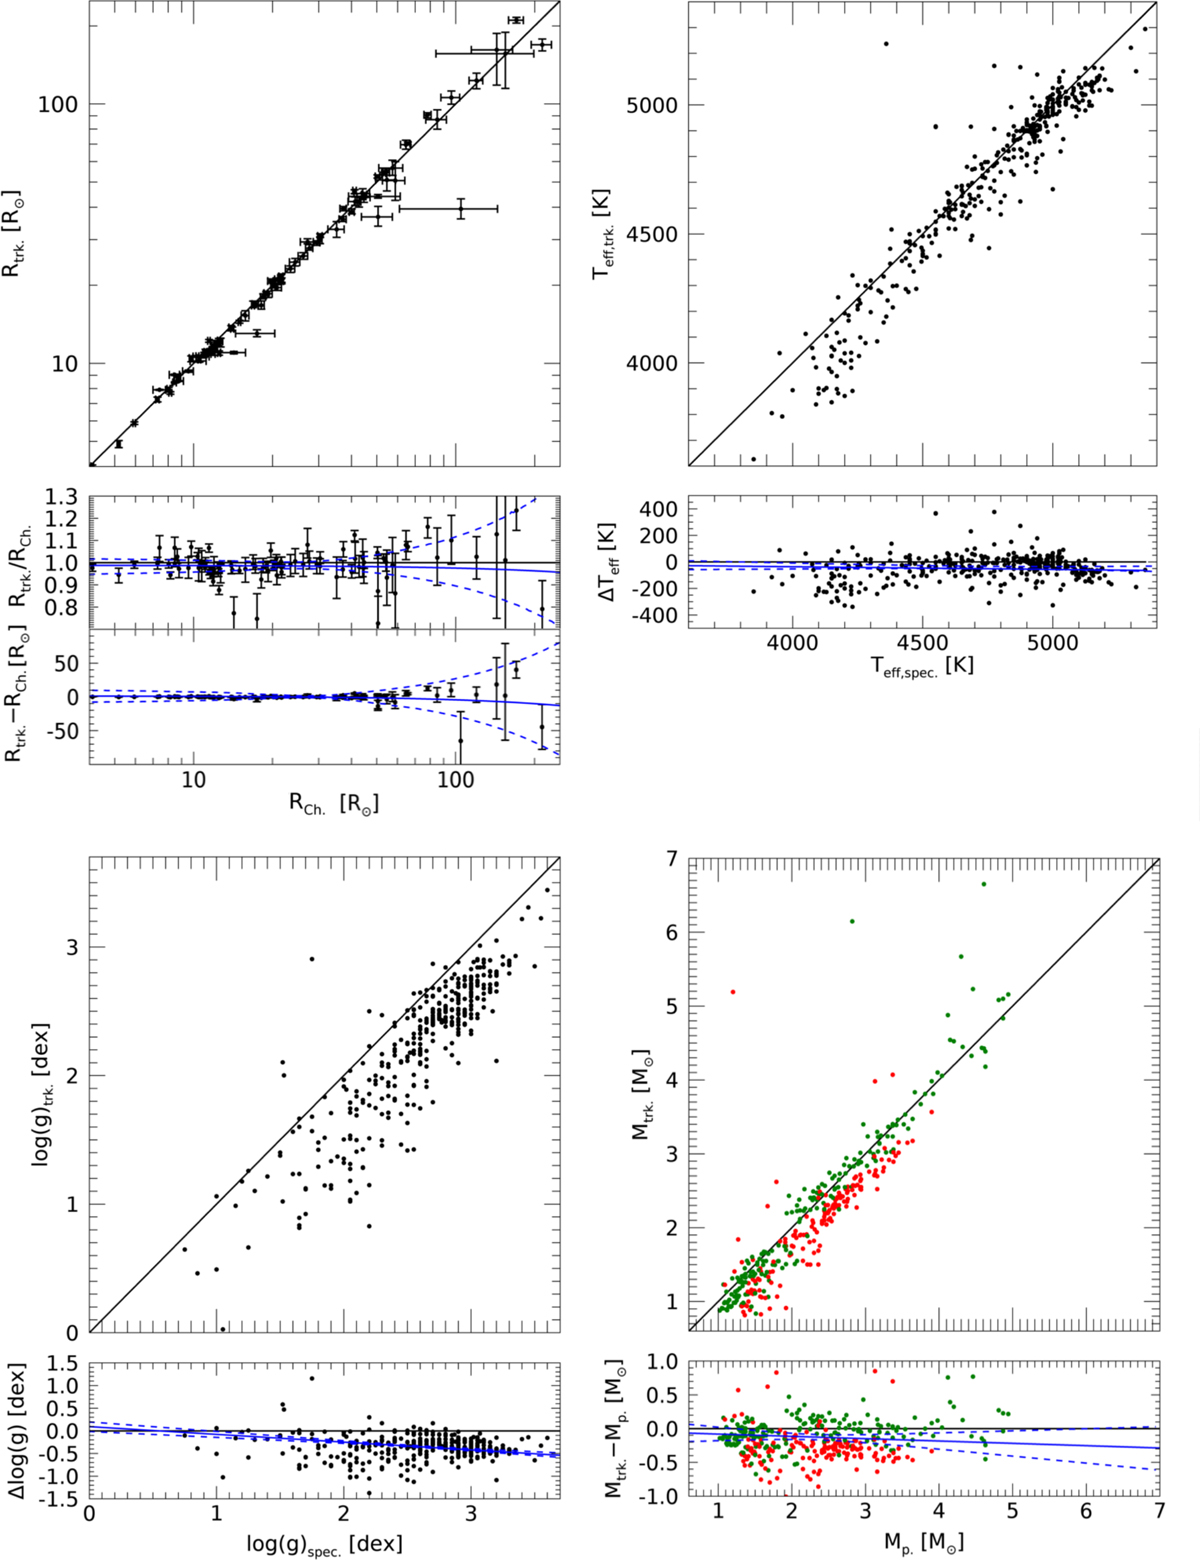
Stellar parameters for the Lick sample compared to literature values. The black line in the upper panels mark the 1:1 correspondence between these parameters. In the lower panel of each diagram we have plotted the corresponding difference or fractional difference of the stellar parameter over the literature value for each giant. The linear best fit to this plot, which takes the full 2D PDFs into account, is represented by the solid blue line, while the dashed blue lines indicate the 95% confidence band of the best fit. Upper left diagram: comparison of Bayesian stellar radii determined via evolutionary tracks to stellar radii estimated by limb-darkened disk diameters from the CHARM2 catalog (Richichi et al. 2005) in conjunction with parallaxes from van Leeuwen (2007). We used logarithmic axes since the stellar radii span two orders of magnitude. Upper right diagram: comparison of Bayesian effective temperature from evolutionary models to spectroscopic effective temperatures by Hekker & Meléndez (2007). We do not show the error bars here, although they are fully taken into account for the linear fit and in the analysis. The error of the spectroscopic result is always 84 K while our median temperature error is around 33 K. Lower left diagram: as in upper right but for the surface gravity. The error for the spectroscopy for each star is 0.22 dex while our median error is 0.04 dex. Lower right diagram: comparison of Bayesian stellar masses from evolutionary tracks to the previously determined stellar masses determined by interpolation from evolutionary tracks (Reffert et al. 2015). Green dots indicate that the evolutionary stage determined by both methods are the same while red dots indicate cases where the evolutionary stage differs.
Current usage metrics show cumulative count of Article Views (full-text article views including HTML views, PDF and ePub downloads, according to the available data) and Abstracts Views on Vision4Press platform.
Data correspond to usage on the plateform after 2015. The current usage metrics is available 48-96 hours after online publication and is updated daily on week days.
Initial download of the metrics may take a while.