Fig. 3.
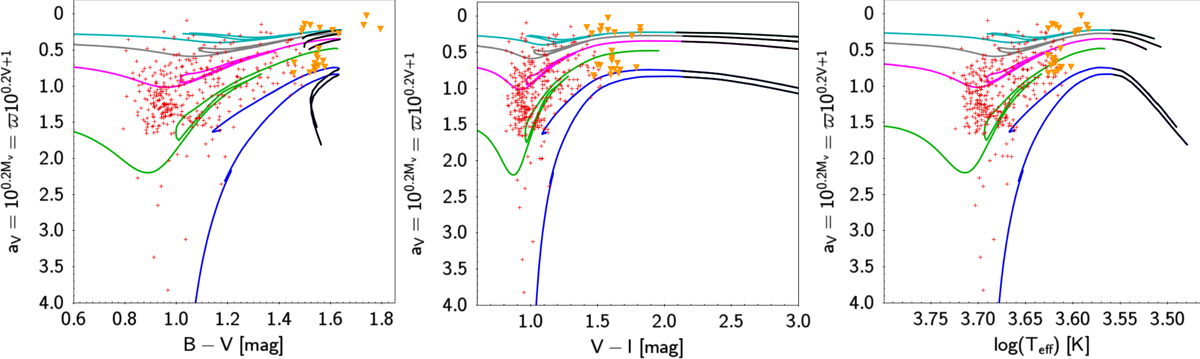
Astrometric HRDs with different x-axes. From left to right: B–V, V–I and log(Teff). The colored lines represent HB and RGB evolutionary tracks with metallicity Z = 0.0180 and masses of 1 M⊙ (blue), 2 M⊙ (green), 3 M⊙ (violet), 4 M⊙ (gray) and 5 M⊙ (turquois). Bold black parts of the evolutionary track show the region that is affected by the degeneracy in B–V due to the differential absorption of TiO bands in M giants, while orange triangles are stars that are in their 1σ range affected by this degeneracy. The astrometric HRDs with V–I or effective temperature plotted on the x-axis show that no giant star of our sample can be attributed to the M-giant region of the evolutionary tracks.
Current usage metrics show cumulative count of Article Views (full-text article views including HTML views, PDF and ePub downloads, according to the available data) and Abstracts Views on Vision4Press platform.
Data correspond to usage on the plateform after 2015. The current usage metrics is available 48-96 hours after online publication and is updated daily on week days.
Initial download of the metrics may take a while.