Fig. 5
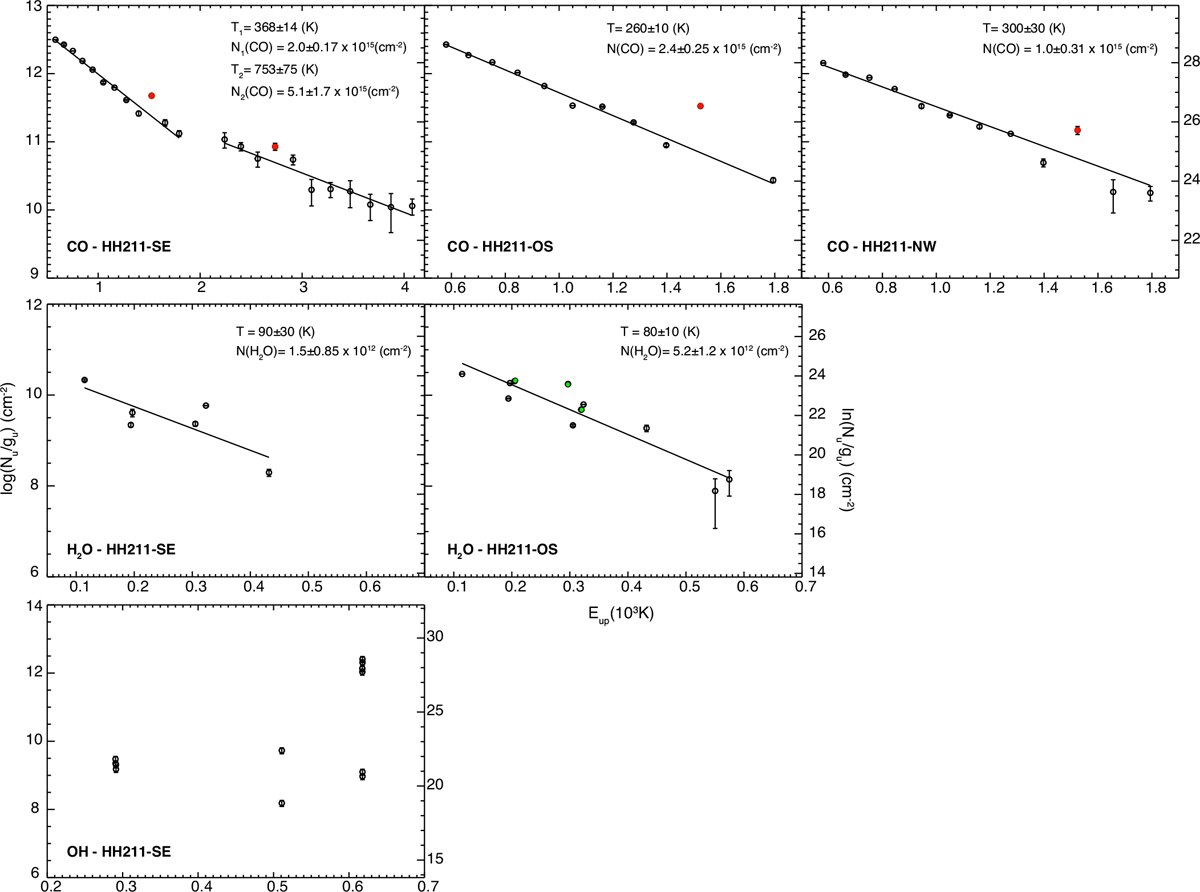
Excitation diagrams of CO, H2O and OH (from top to bottom panels) at the southeast (SE), on-source (OS) and northwest positions (NW), respectively (left to right panels). Derived temperatures and column densities are reported in the top-left corner of each panel. Filled (red) circles in the CO panels correspond to blended lines that were not taken into account in the linear fits. Filled (green) circles in the on-source H2O diagram correspond to para-lines.
Current usage metrics show cumulative count of Article Views (full-text article views including HTML views, PDF and ePub downloads, according to the available data) and Abstracts Views on Vision4Press platform.
Data correspond to usage on the plateform after 2015. The current usage metrics is available 48-96 hours after online publication and is updated daily on week days.
Initial download of the metrics may take a while.