Fig. 1
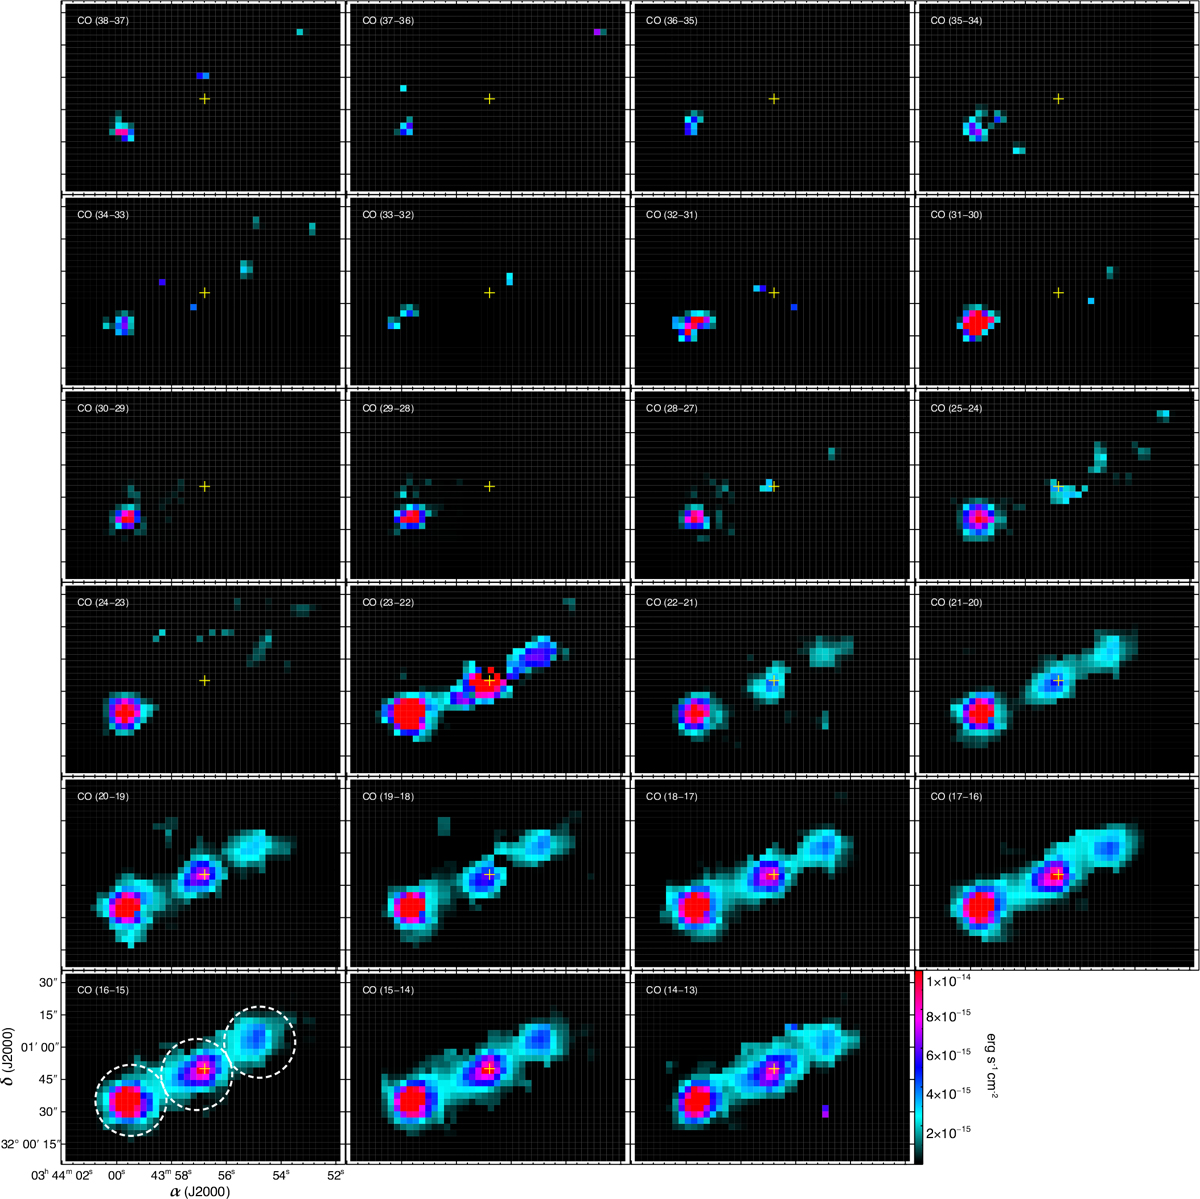
CO line maps, starting from the J = 38−37 transition at 69 μm in the upper left corner to J = 14−13 at 183 μm at the lower right panel. The J = 23−22 map is blended and dominated in the central and northwest regions by the 414 − 303 o-H2O line. The yellow cross indicates the position of the protostellar source and the dashed circles in the lower left panel delineate the three extraction regions for which excitation diagrams are constructed (see Sect. 4.1).
Current usage metrics show cumulative count of Article Views (full-text article views including HTML views, PDF and ePub downloads, according to the available data) and Abstracts Views on Vision4Press platform.
Data correspond to usage on the plateform after 2015. The current usage metrics is available 48-96 hours after online publication and is updated daily on week days.
Initial download of the metrics may take a while.