Fig. C.1
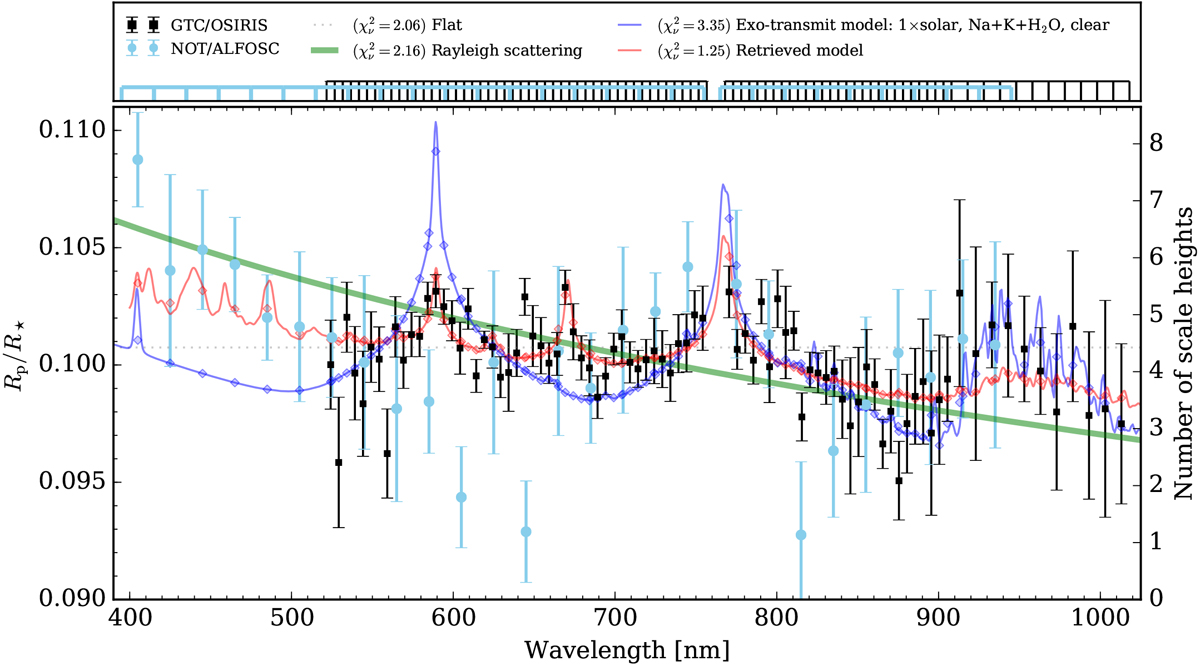
Transmission spectrum of WASP-127b. The GTC/OSIRIS and NOT/ALFOSC measurements are shown in squares and circles with error bars, respectively. A flat line is used to represent the optically thick clouds. The green line shows a representative pure Rayleigh scattering atmosphere. The purple line shows a fiducial atmospheric model with the solar abundance, with Na, K, and H2 O included, and with an isothermal temperature of 1400 K (Kempton et al. 2017). The red line shows the retrieved model spectrum from our retrieval modeling. The binned models are shown in diamonds. One atmospheric scale height is equivalent to Heq ∕R⋆ = 0.00243. All the reduced chi-squares in this plot only simply consider the offset as a free parameter.
Current usage metrics show cumulative count of Article Views (full-text article views including HTML views, PDF and ePub downloads, according to the available data) and Abstracts Views on Vision4Press platform.
Data correspond to usage on the plateform after 2015. The current usage metrics is available 48-96 hours after online publication and is updated daily on week days.
Initial download of the metrics may take a while.