Fig. A.1
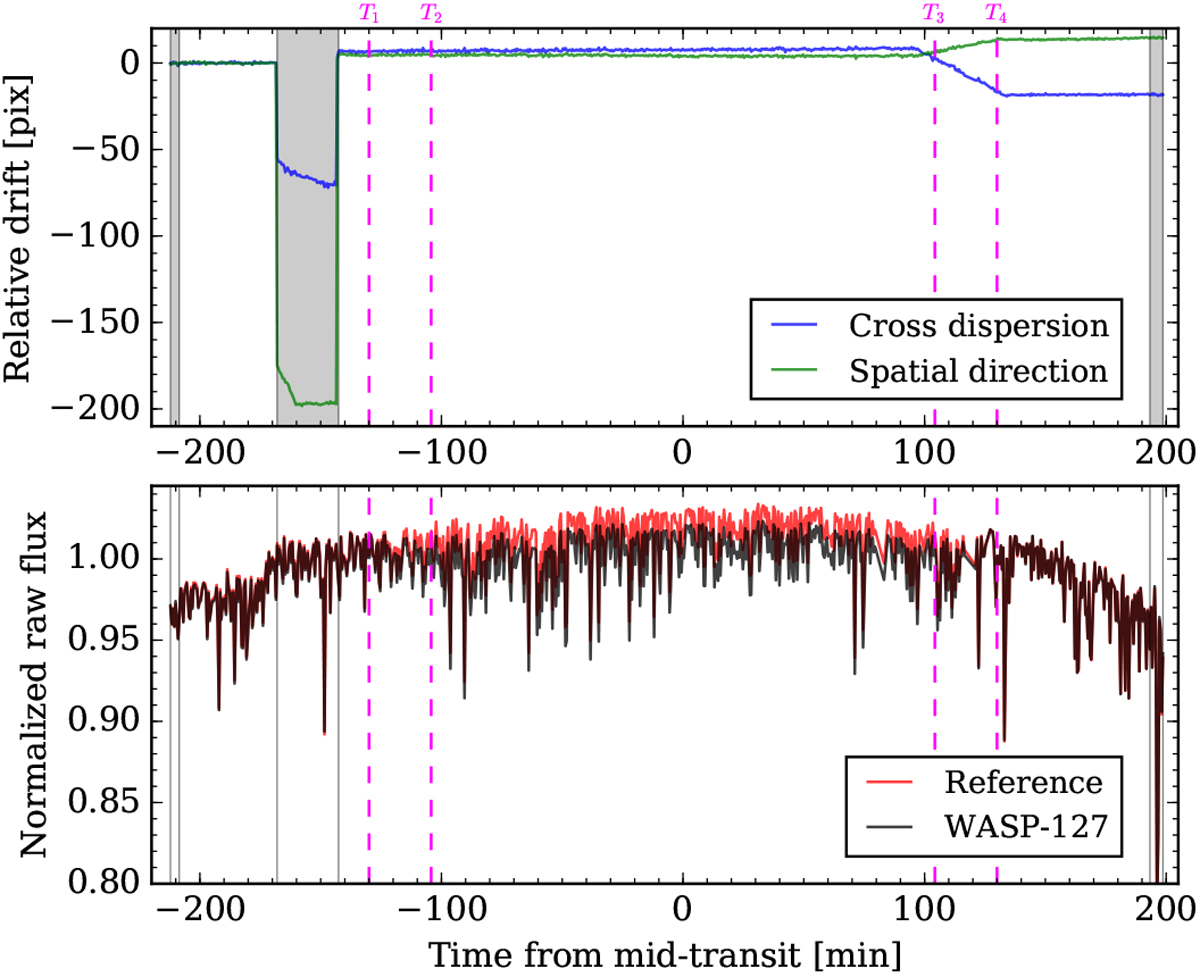
Spectral movements and the raw flux time series. Top panel: drift of spectra location in the cross-dispersion (blue) and spatial (green) directions. Bottom panel: normalized raw flux of WASP-127 (black) and its reference star (red). The gray shaded areas indicate the discarded exposures that are not included in subsequent light-curve modeling, where the two regions on the edge are impacted by high airmass, the region on the right edge is also impacted by morningtwilight, and the middle region has severely lost guiding. The vertical dashed lines indicate the first (T1), second (T2), third (T3), and fourth (T4) contact of the transit event.
Current usage metrics show cumulative count of Article Views (full-text article views including HTML views, PDF and ePub downloads, according to the available data) and Abstracts Views on Vision4Press platform.
Data correspond to usage on the plateform after 2015. The current usage metrics is available 48-96 hours after online publication and is updated daily on week days.
Initial download of the metrics may take a while.