Fig. 8.
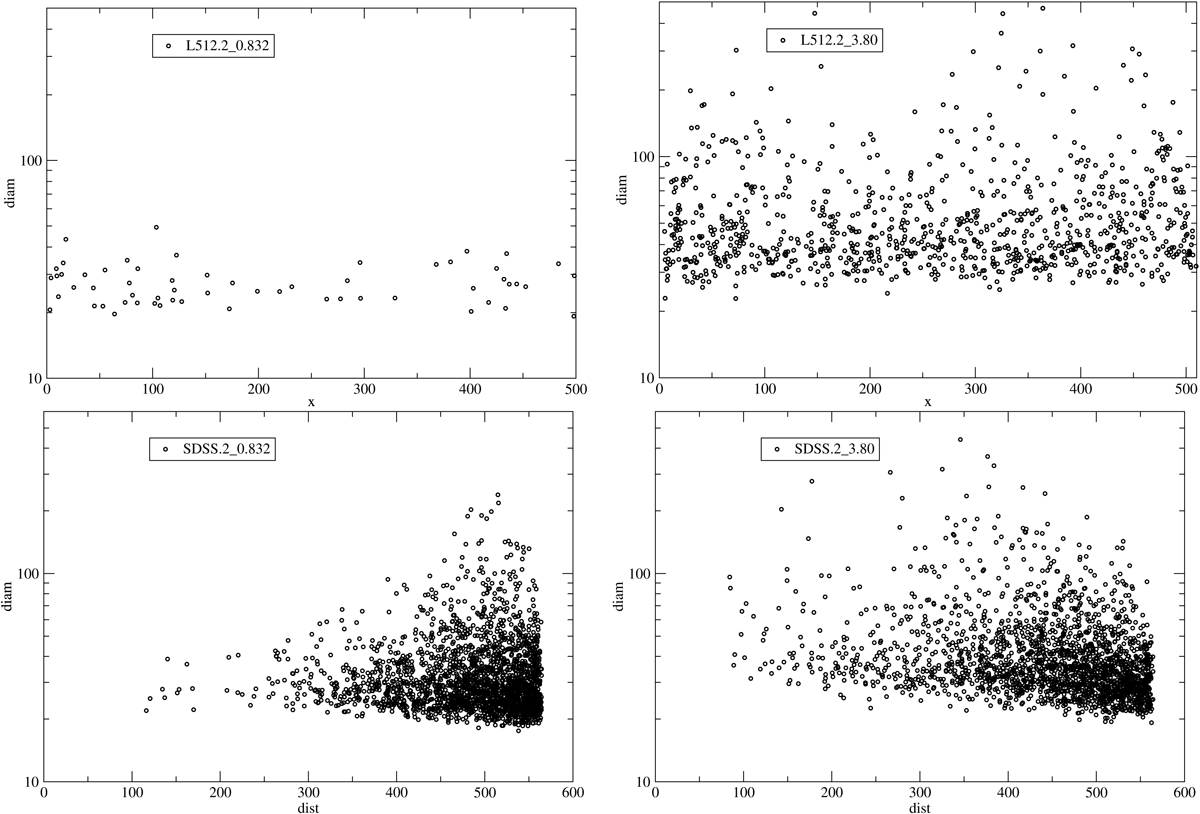
Top: diameters of clusters versus x-coordinate of the sample L512.2, at threshold densities Dt = 0.832, 3.80, left and right panels, respectively. Bottom: diameters of clusters vs. distance from the observer for the SDSS.2 sample at the same threshold densities. Diameters and distances (x-coordinates) are given in h−1 Mpc; diameters are plotted in a logarithmic scale. Largest percolating clusters are not shown. In all samples a small cluster exclusion limit, Nlim = 500, is applied.
Current usage metrics show cumulative count of Article Views (full-text article views including HTML views, PDF and ePub downloads, according to the available data) and Abstracts Views on Vision4Press platform.
Data correspond to usage on the plateform after 2015. The current usage metrics is available 48-96 hours after online publication and is updated daily on week days.
Initial download of the metrics may take a while.