Fig. 7.
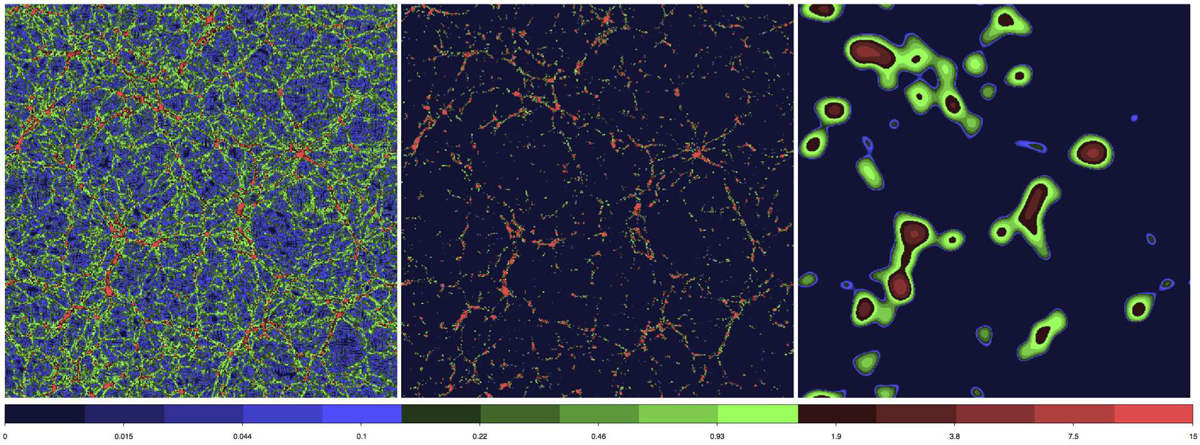
Density fields in 256 × 256 × 0.5 h−1 Mpc slices of the L256 model at identical z-coordinates. Left panel: density field smoothed with the kernel of radius 1 h−1 Mpc in density interval 0.005–15 in mean density units; the colour code below corresponds to this field. Middle panel: same density field in density interval 1.5–15 in mean density units. Faint filaments between high-density knots are invisible. Right panel: field smoothed with kernel 8 h−1 Mpc in interval 1.5–15 in mean density units. Filaments are thicker and percolate easier. In all panels densities are expressed in logarithmic scale.
Current usage metrics show cumulative count of Article Views (full-text article views including HTML views, PDF and ePub downloads, according to the available data) and Abstracts Views on Vision4Press platform.
Data correspond to usage on the plateform after 2015. The current usage metrics is available 48-96 hours after online publication and is updated daily on week days.
Initial download of the metrics may take a while.