Fig. 6.
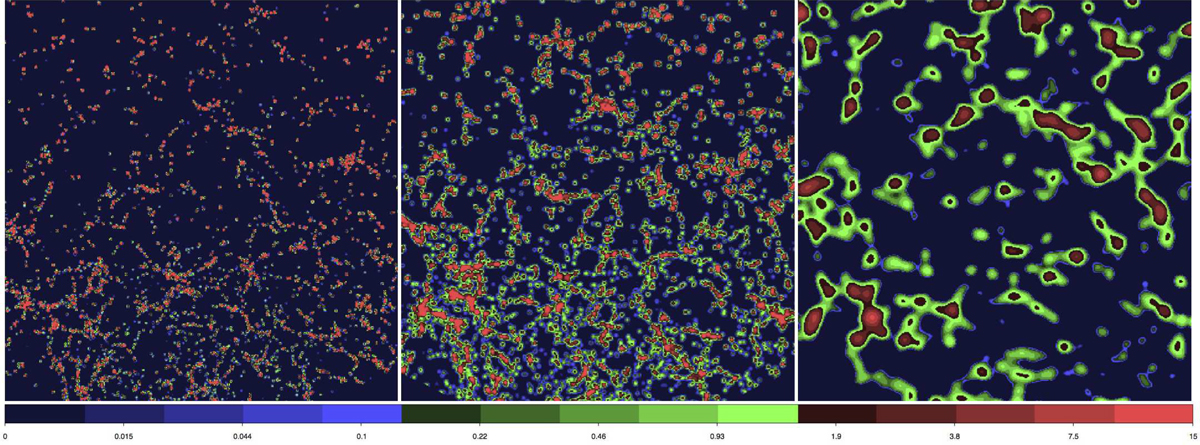
Luminosity density fields in 400 × 400 × 1 h−1 Mpc slices at identical z−coordinates of the central region of the SDSS sample, smoothed with kernels of radii 1, 2, and 8 h−1 Mpc (left, middle, and right panels). This figure illustrates the effect of the smoothing length to geometrical properties of clusters and voids. Densities are expressed in logarithmic scale in interval 0.005–15 in mean density units. The colour code is identical in all panels.
Current usage metrics show cumulative count of Article Views (full-text article views including HTML views, PDF and ePub downloads, according to the available data) and Abstracts Views on Vision4Press platform.
Data correspond to usage on the plateform after 2015. The current usage metrics is available 48-96 hours after online publication and is updated daily on week days.
Initial download of the metrics may take a while.