Fig. 5.
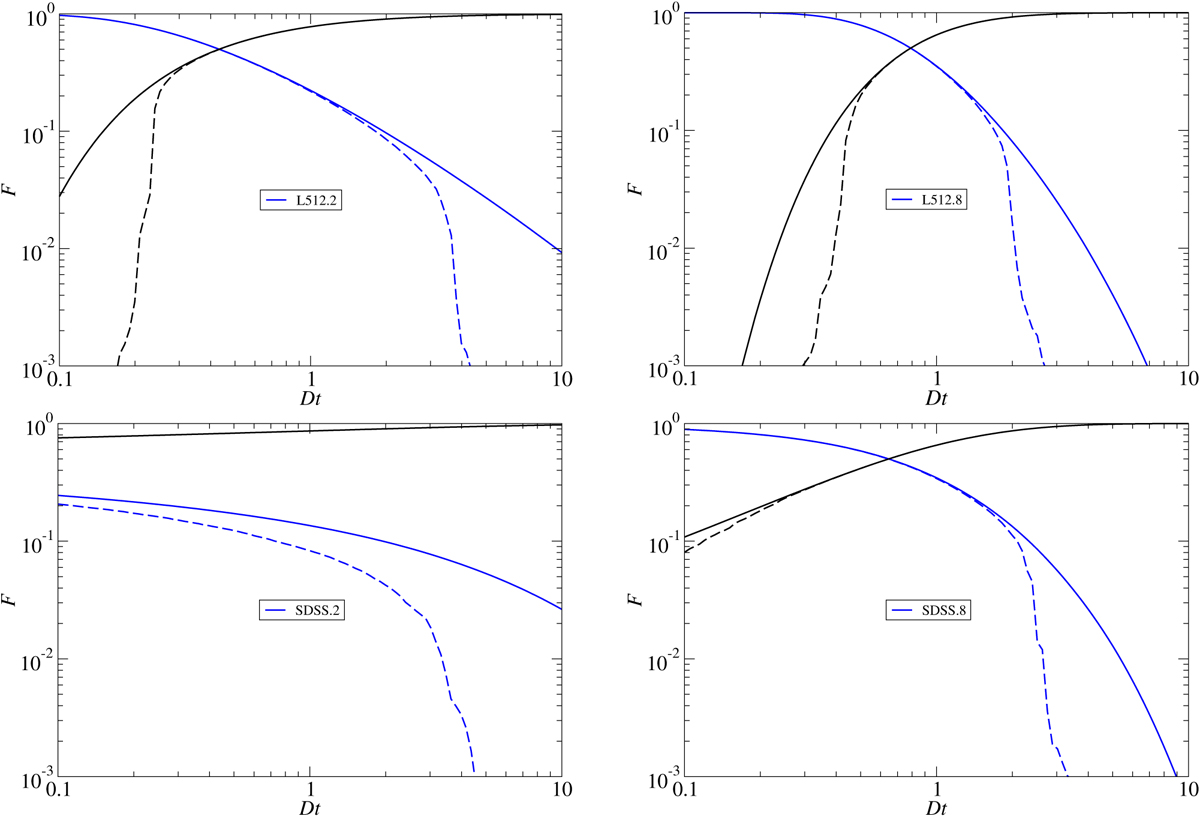
Filling factor functions of the model L512: total filling factors of clusters and voids, ℱtot, and filling factors of maximal clusters and voids, ℱmax, as functions of threshold density, Dt, plotted in logarithmic scales. Solid lines indicate total filling factors of high- and low-density regions, dashed lines indicate maximal clusters and voids, blue indicates clusters, and black indicates voids. Functions are calculated using smoothing kernels 2 and 8 h−1 Mpc (left and right panels). Bottom row: the same functions for observed SDSS samples.
Current usage metrics show cumulative count of Article Views (full-text article views including HTML views, PDF and ePub downloads, according to the available data) and Abstracts Views on Vision4Press platform.
Data correspond to usage on the plateform after 2015. The current usage metrics is available 48-96 hours after online publication and is updated daily on week days.
Initial download of the metrics may take a while.