Fig. 2.
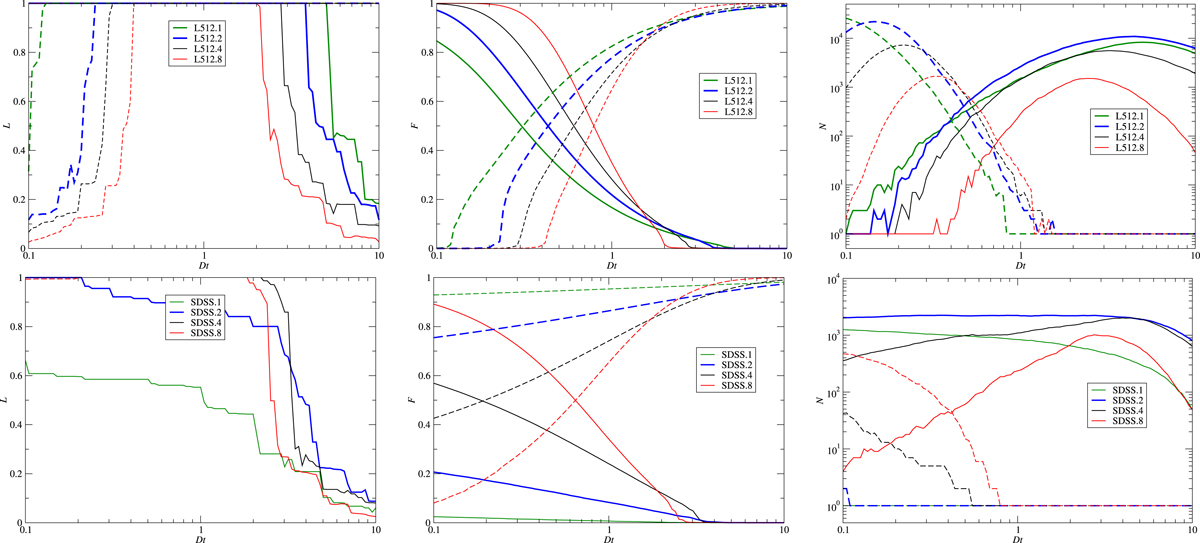
Percolation functions of model and observational samples: left panels: lengths of largest clusters and voids, ℒ(Dt) = Lmax/L0; centre panels: filling factors of largest clusters and voids, ℱ (Dt) = Vmax/V0; right panels: numbers of clusters and voids, N(Dt), as functions of the threshold density, Dt. Lengths and filling factors are expressed in units of the total lengths and volumes of samples. Top panels represent the DM model L512; bottom panels represent the SDSS samples. Percolation functions are found using smoothing kernels of radii 1, 2, 4, and 8 h−1 Mpc. Solid lines show data on clusters, and dashed lines on voids. Indices show the smoothing kernel length in h−1 Mpc. Number functions N(Dt) of DM models in this figure correspond to small system excursion limit Nlim = 50 cells.
Current usage metrics show cumulative count of Article Views (full-text article views including HTML views, PDF and ePub downloads, according to the available data) and Abstracts Views on Vision4Press platform.
Data correspond to usage on the plateform after 2015. The current usage metrics is available 48-96 hours after online publication and is updated daily on week days.
Initial download of the metrics may take a while.