Fig. 1.
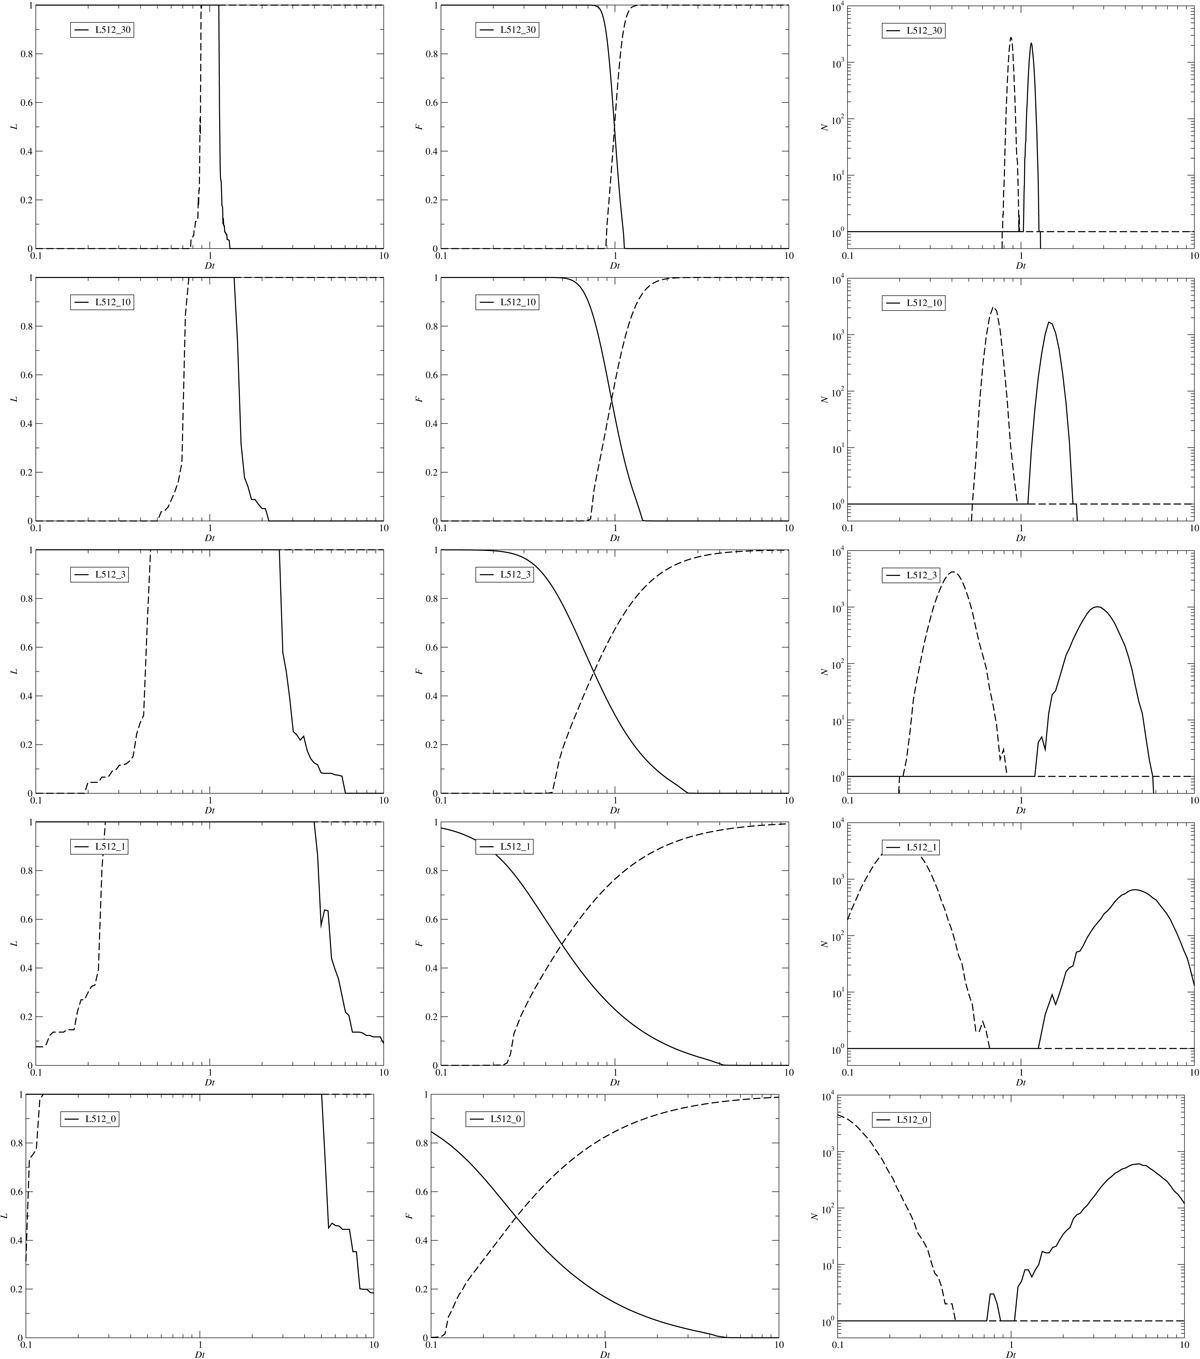
Change of percolation functions of the model L512 with simulation epoch. Panels from top to bottom are for the initial epoch, z = 30, and epochs z = 10, z = 3, z = 1, and z = 0. Left panels: lengths of largest clusters and voids, ℒ(Dt) = Lmax/L0; centre panels: filling factors of largest clusters and voids, ℱ (Dt) = Vmax/V0; right panels: numbers of clusters and voids, N(Dt); all as functions of the threshold density, Dt. Functions are found for original non-smoothed density fields, which correspond to a resolution 1 h−1 Mpc. Functions for clusters are plotted with solid lines, for voids with dashed lines.
Current usage metrics show cumulative count of Article Views (full-text article views including HTML views, PDF and ePub downloads, according to the available data) and Abstracts Views on Vision4Press platform.
Data correspond to usage on the plateform after 2015. The current usage metrics is available 48-96 hours after online publication and is updated daily on week days.
Initial download of the metrics may take a while.