Fig. 1
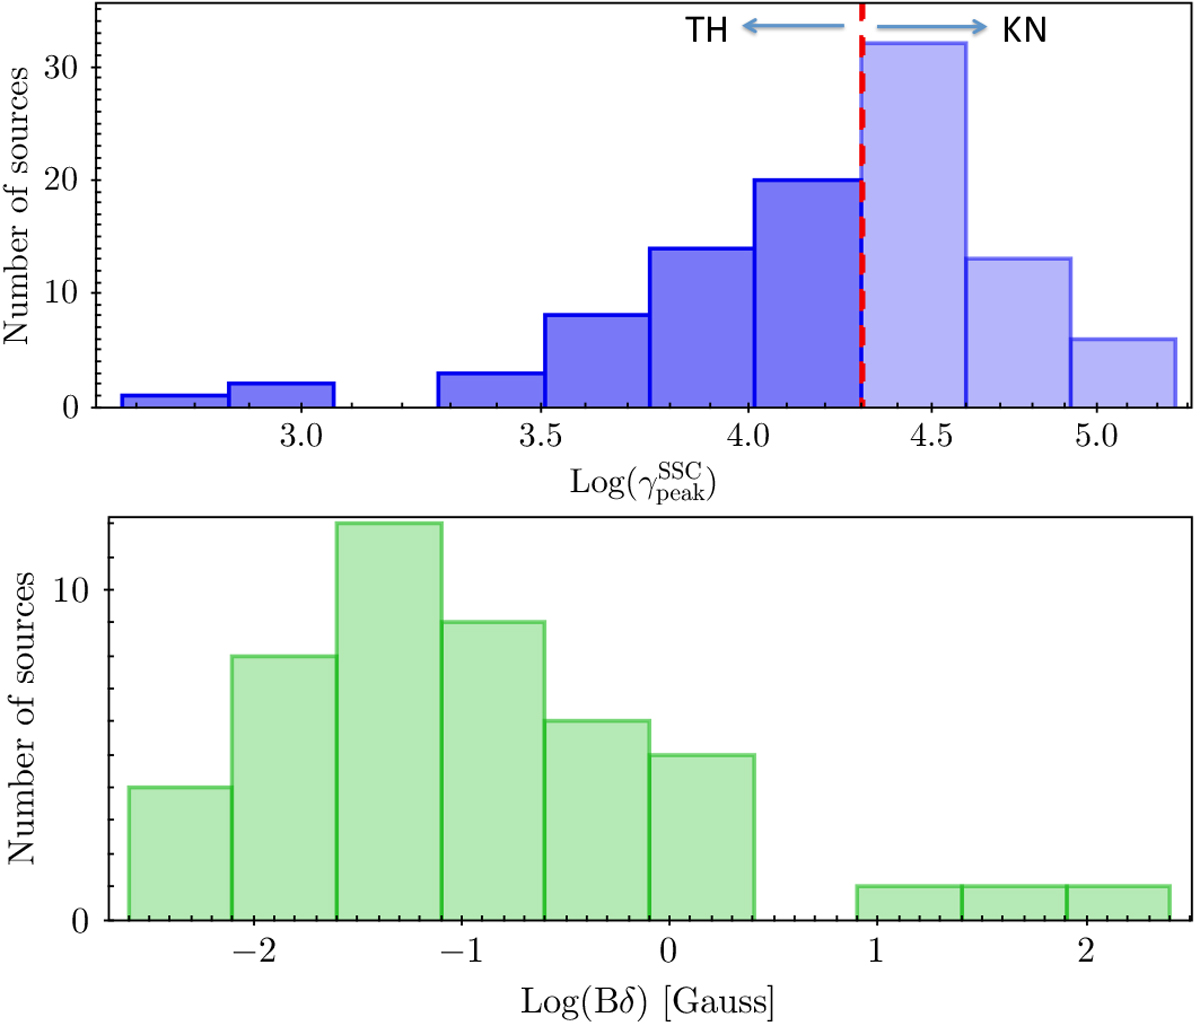
Top panel: distribution of Lorentz factor ![]() for electrons emitting in the peak of the Syn component (Eq. (2)). The red dashed line shows the limit for
for electrons emitting in the peak of the Syn component (Eq. (2)). The red dashed line shows the limit for ![]() values where the transition from TH to KN scattering regime occurs. Bottom panel: distribution of the B δ parameter for LSP sources assuming a SSC model, and considering only sources with
values where the transition from TH to KN scattering regime occurs. Bottom panel: distribution of the B δ parameter for LSP sources assuming a SSC model, and considering only sources with ![]() (under TH regime).
(under TH regime).
Current usage metrics show cumulative count of Article Views (full-text article views including HTML views, PDF and ePub downloads, according to the available data) and Abstracts Views on Vision4Press platform.
Data correspond to usage on the plateform after 2015. The current usage metrics is available 48-96 hours after online publication and is updated daily on week days.
Initial download of the metrics may take a while.