Fig. 5.
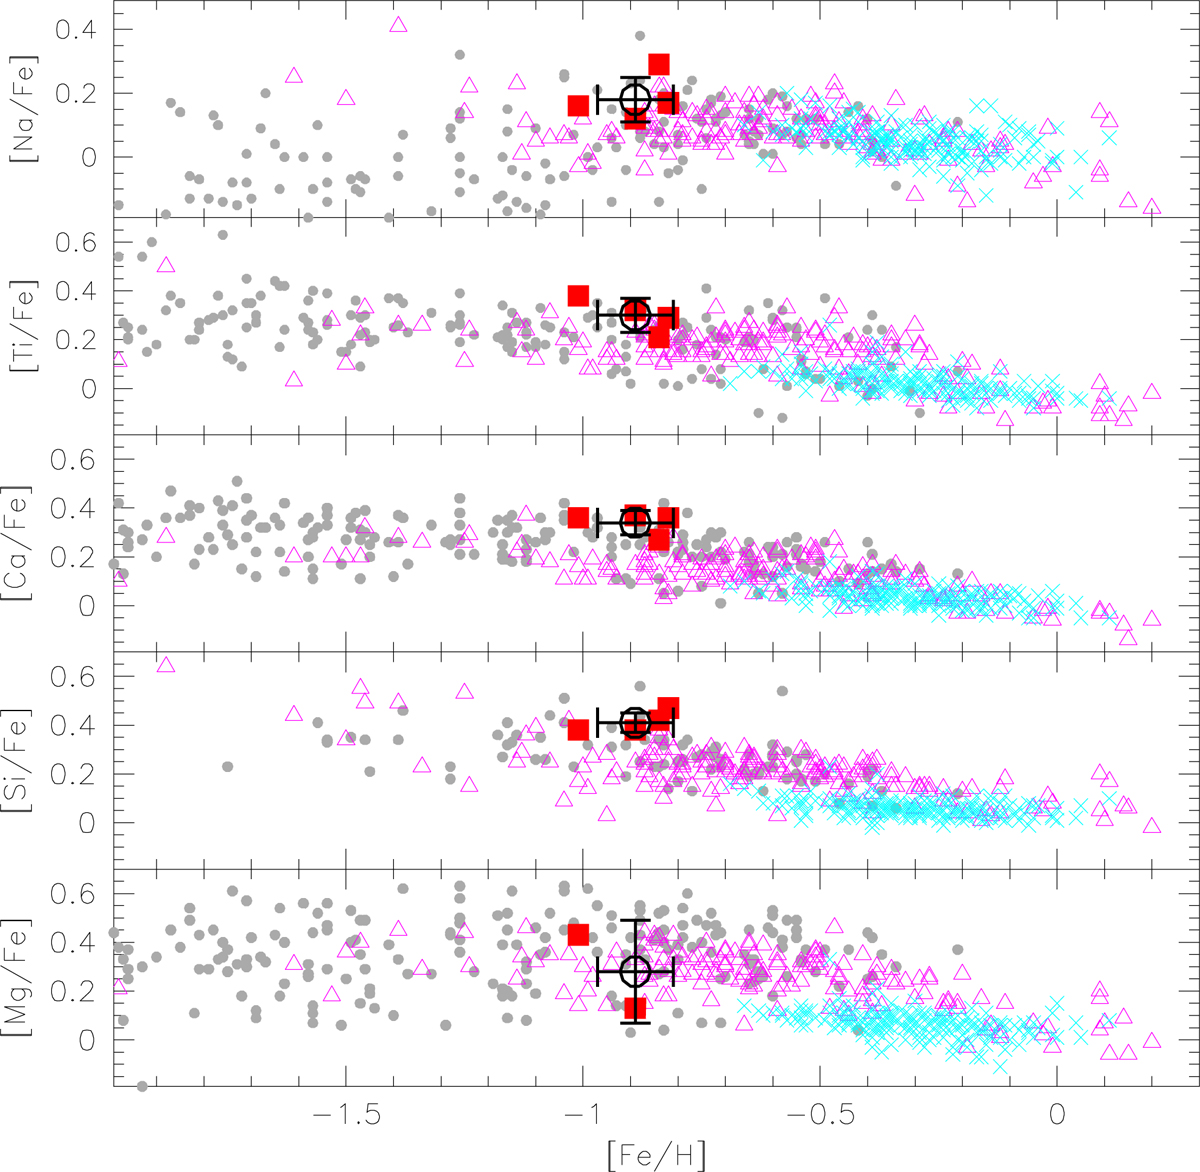
Run of [Na/Fe] and α-element abundance ratios ([Ti/Fe], [Ca/Fe], [Si/Fe], [Mg/Fe] from top to bottom) versus [Fe/H] for E3 (filled red squares) and Galactic stars. The large black open circle with error bars indicates the mean cluster abundance and Gaussian dispersion. Gray filled circles are halo stars from Gratton et al. (2003, their dissipative component) and Venn et al. (2004, halo probability greater than 0.8). Open magenta triangles are thick disk stars from Reddy et al. (2006), while cyan crosses are thin disk stars from Reddy et al. (2003).
Current usage metrics show cumulative count of Article Views (full-text article views including HTML views, PDF and ePub downloads, according to the available data) and Abstracts Views on Vision4Press platform.
Data correspond to usage on the plateform after 2015. The current usage metrics is available 48-96 hours after online publication and is updated daily on week days.
Initial download of the metrics may take a while.