Fig. 4.
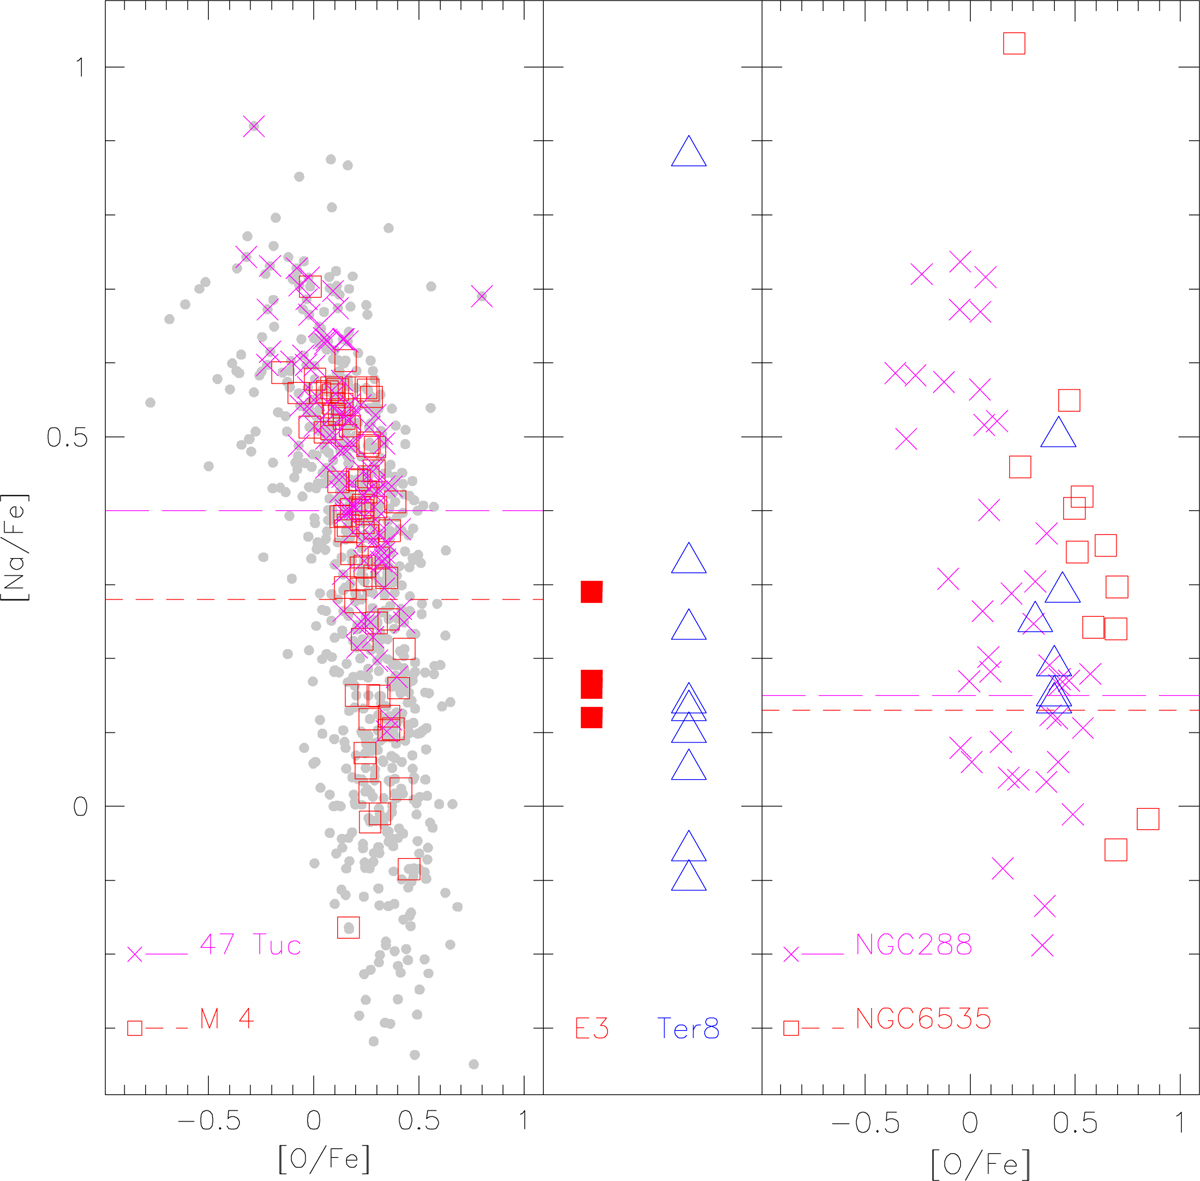
Left panel: Na-O anti-correlation ([Na/Fe] versus [O/Fe]) for the sample of GCs studied by Carretta et al. (2009a,b). M4 and 47 Tuc stars are marked as red open squares and magenta crosses, respectively. The short- long-dashed red and magenta lines indicate the separation between FG and SG stars in the two clusters, according to Carretta et al. (2010). Right panel: same as left panel, but for NGC 288 (magenta crosses), Ter 8 (Carretta et al. 2014, open blue triangles for stars with both O and Na measures), and NGC 6535 (Bragaglia et al. 2017, upper limits excluded). Middle panel: E3 (filled red squares) and Ter 8 (Carretta et al. 2014, stars with Na measures only) Na abundances.
Current usage metrics show cumulative count of Article Views (full-text article views including HTML views, PDF and ePub downloads, according to the available data) and Abstracts Views on Vision4Press platform.
Data correspond to usage on the plateform after 2015. The current usage metrics is available 48-96 hours after online publication and is updated daily on week days.
Initial download of the metrics may take a while.