Fig. 1.
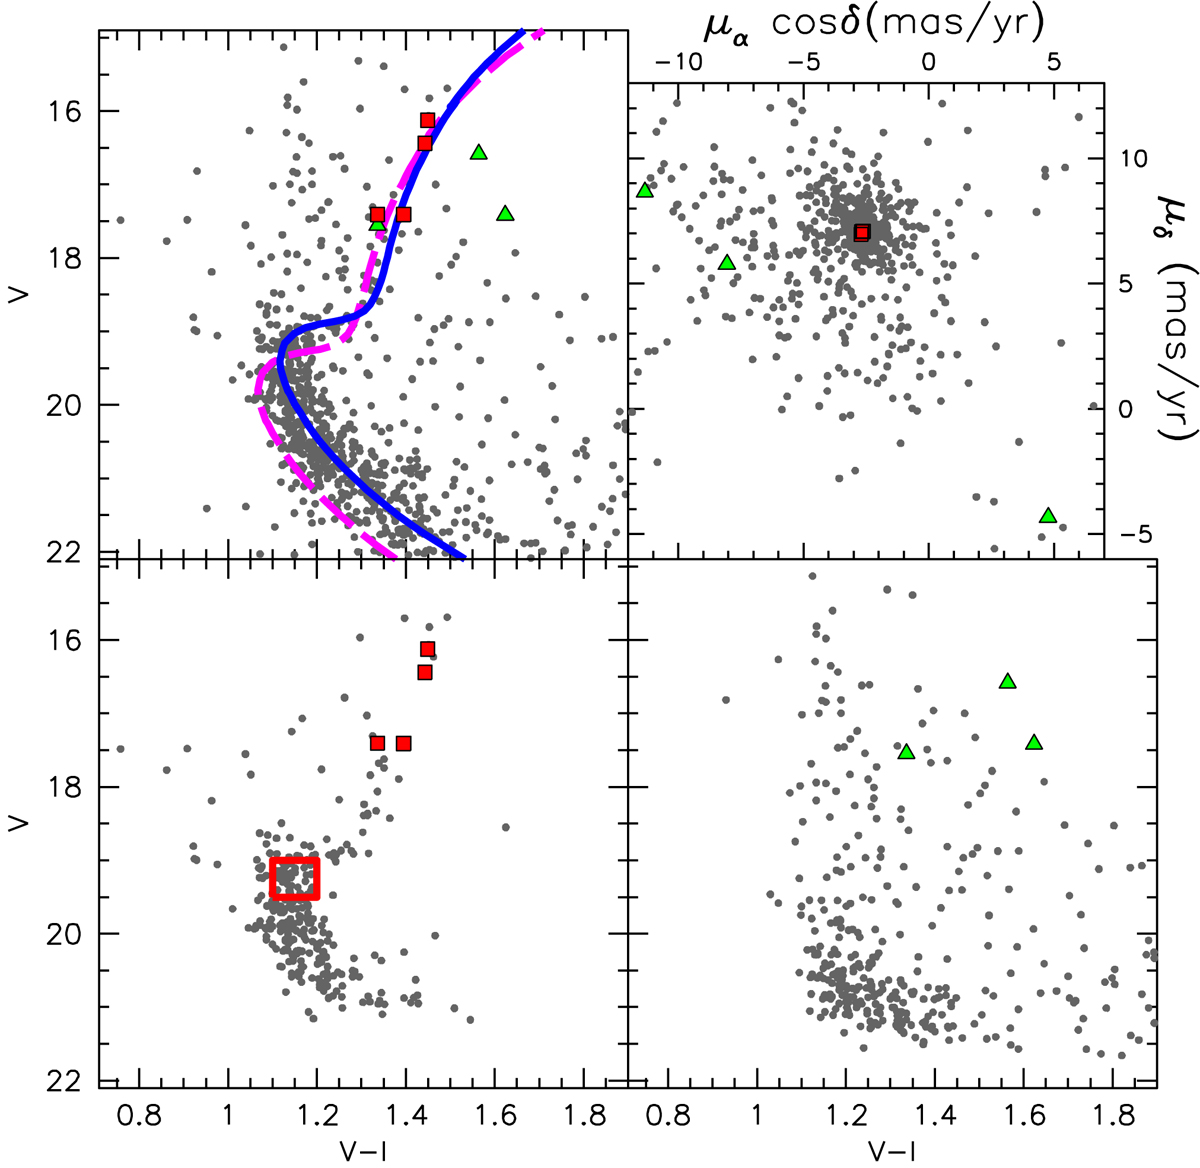
Upper left panel: E3 V versus V–I color magnitude diagram. Target stars are marked by large filled symbols. Filled red squares are E3 radial velocity members. The continuous and dashed lines are Z = 0.003, 13 Gyr isochrones from the PARSEC collection (Bressan et al. 2012) where the visual distance modulus and reddening are the values we adopt here from FM15 (continuous blue line) or from Harris (1996, 2010 revision, dashed magenta line). Upper right panel: Gaia DR2 proper motions of stars cross-identified from the photometry in the upper left panel. RV members (red filled squares) have very similar PMs, and thus are almost superposed on each other in the figure. Lower left panel: CMD of stars having PMs within three times the errors from the mean E3 PM. Stars in the cross-identified catalog and having 19.0 < V < 19.5; 1.1 < V–I < 1.2 (red box) were used to select the MS stars that were used to define the cluster mean PM. Lower right panel: CMD of stars having PMs exceeding three times the errors from the mean E3 proper motion.
Current usage metrics show cumulative count of Article Views (full-text article views including HTML views, PDF and ePub downloads, according to the available data) and Abstracts Views on Vision4Press platform.
Data correspond to usage on the plateform after 2015. The current usage metrics is available 48-96 hours after online publication and is updated daily on week days.
Initial download of the metrics may take a while.