Fig. A.2
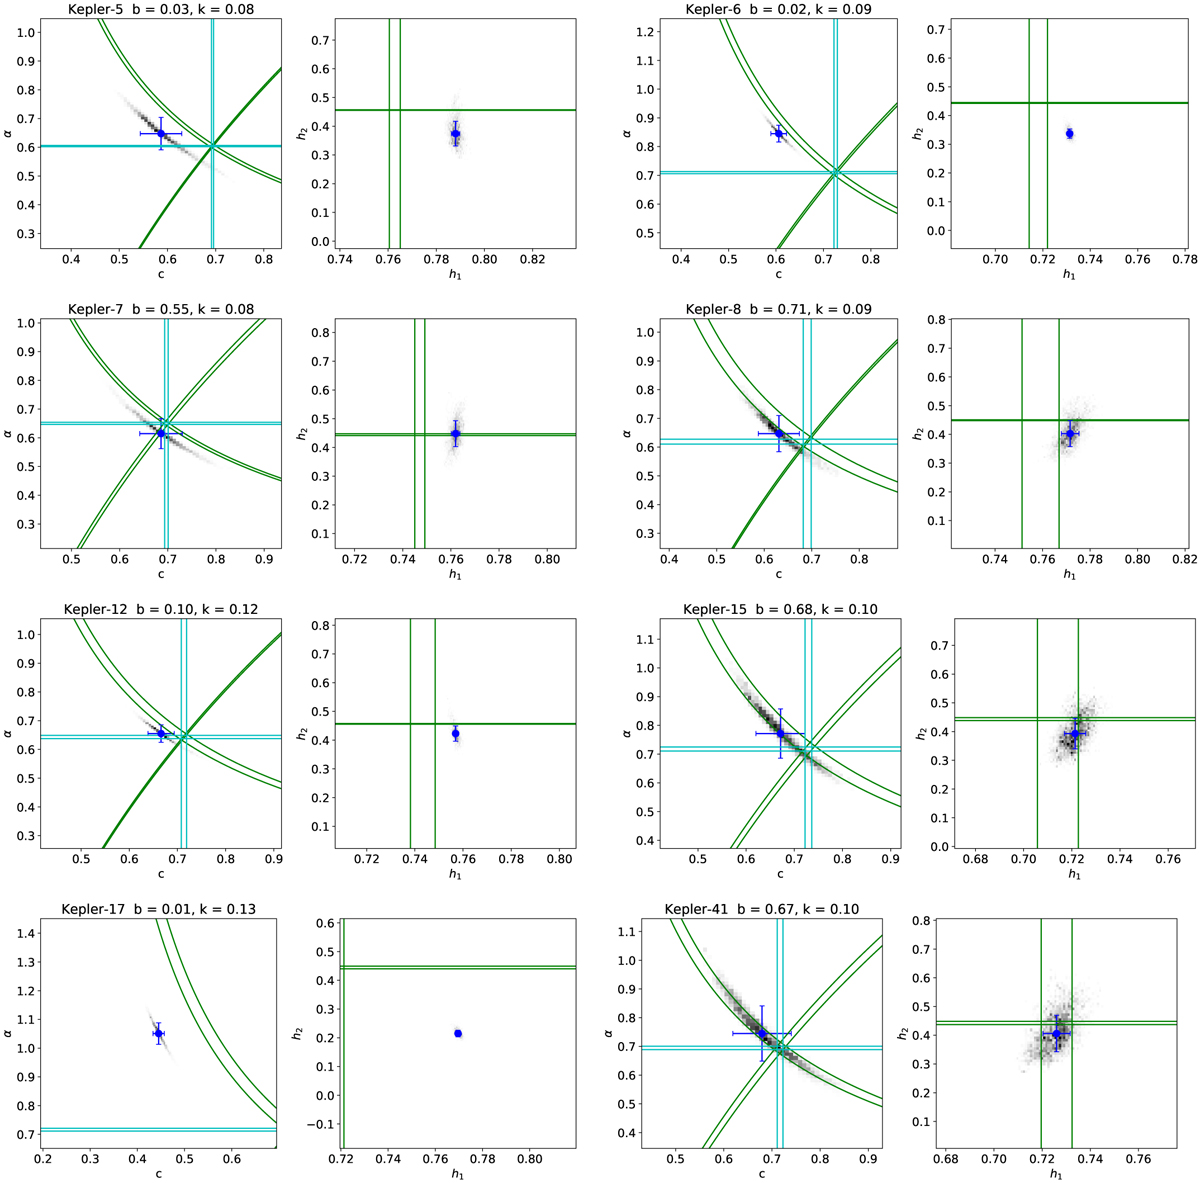
Posterior probability distributions for the limb-darkening parameters from the analysis of the Kepler light curves. The PPDs are shown as gray-scale density plots. The median values and standard deviations for each parameter are shown as an error bar. The vertical and horizontal lines in the left-hand panel for each star show the ± 1-σ limits on the computed values of c and α. The corresponding ± 1-σ limits on h1 and h2 are shown as curved lines in the same panel and as vertical and horizontal lines in the right-hand panel.
Current usage metrics show cumulative count of Article Views (full-text article views including HTML views, PDF and ePub downloads, according to the available data) and Abstracts Views on Vision4Press platform.
Data correspond to usage on the plateform after 2015. The current usage metrics is available 48-96 hours after online publication and is updated daily on week days.
Initial download of the metrics may take a while.