Free Access
Fig. A.1
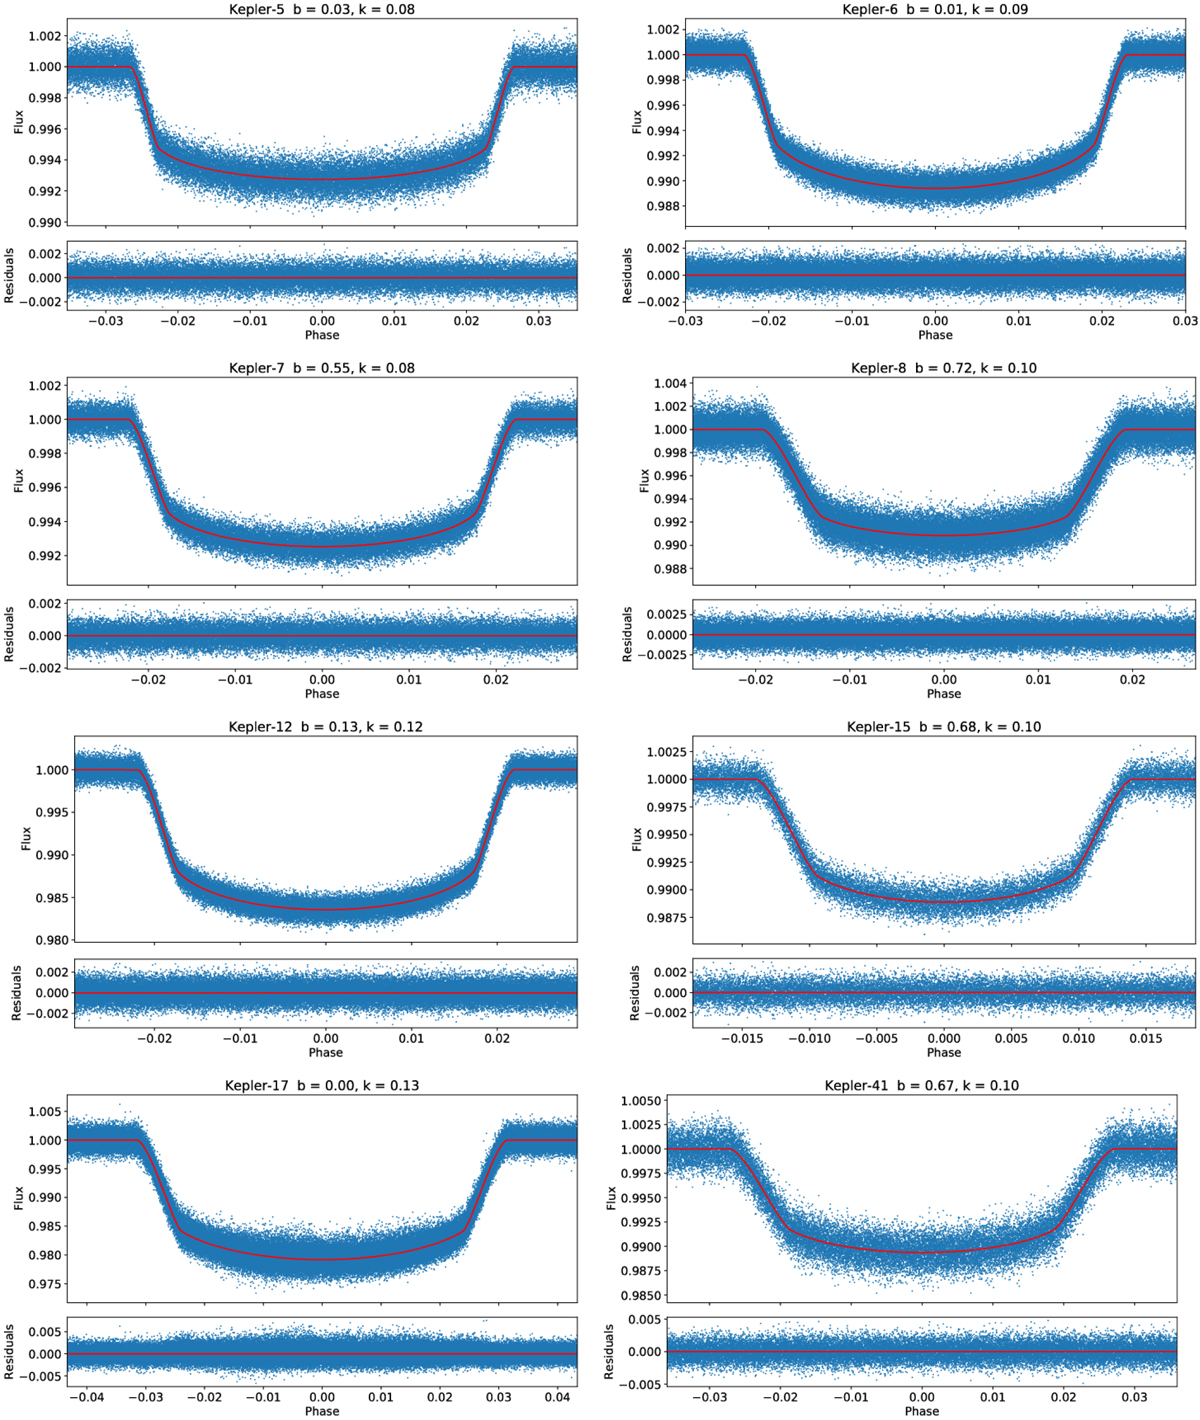
Kepler light curves of transiting exoplanet and binary star systems. Observations are plotted using small points and the best-fit light curve model is shown as a line. The name of each star is noted in the title to each panel together with the impact parameter b = a cosi∕R⋆ and the ratioof the radii k = Rpl∕R⋆.
Current usage metrics show cumulative count of Article Views (full-text article views including HTML views, PDF and ePub downloads, according to the available data) and Abstracts Views on Vision4Press platform.
Data correspond to usage on the plateform after 2015. The current usage metrics is available 48-96 hours after online publication and is updated daily on week days.
Initial download of the metrics may take a while.