Fig. 5
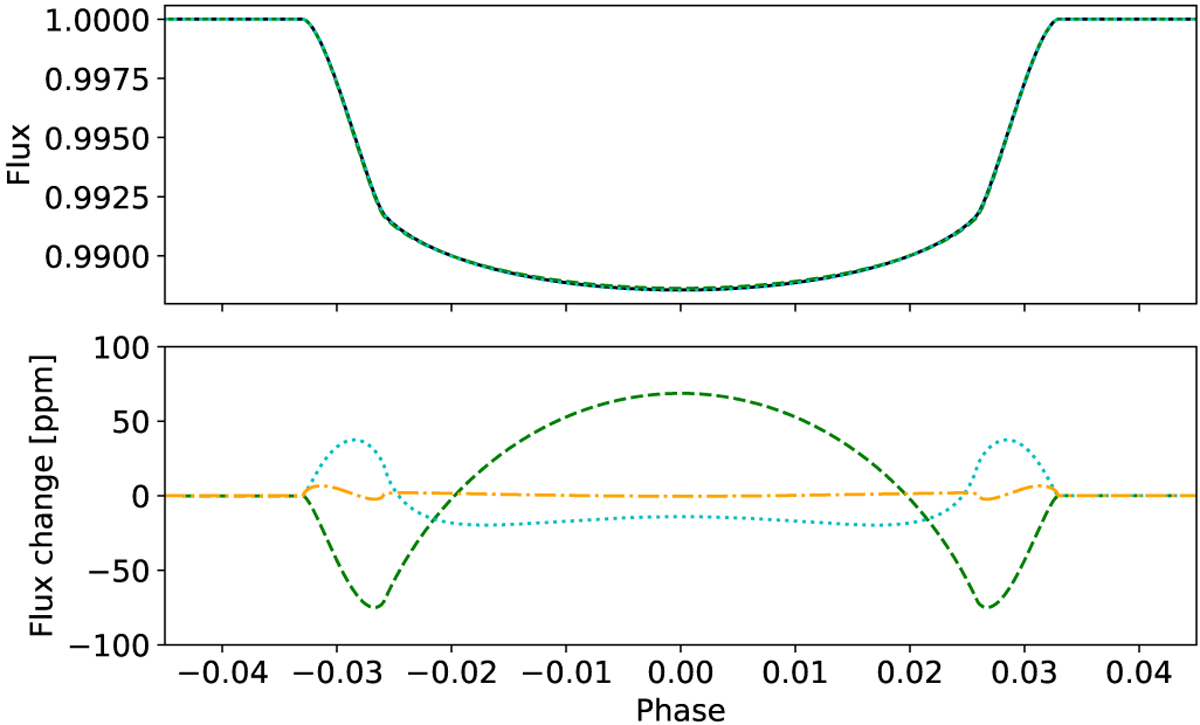
A simulated light curve for the following parameters: R⋆/a = 0.2, k = 0.1, b = 0.4, q = 0.0008, h1 = 0.75 ± 0.01, h2 = 0.45 ± 0.05. The upper plot shows the light curve for the nominal values of h1 and h2 and (indistinguishable at this scale) the light curves for both h1 and h2 perturbed upwards by one standard deviation. The lower plot shows the change in flux due to a change by +1 standard deviation in h1 (dashed line) and h2 (dotted line). Also shown in the lower panel is the effect of using a sphere to model the shape of the transiting planet instead of a polytrope (dot-dashed line). Note that in the latter case the radius of the sphere has been reduced by 0.5% cf. the volume-average radius of the ellipsoid used to model the planet as a polytrope. This correction is required so that the eclipse depth for the spherical planet case matches the eclipse depth for the ellipsoidal planet model.
Current usage metrics show cumulative count of Article Views (full-text article views including HTML views, PDF and ePub downloads, according to the available data) and Abstracts Views on Vision4Press platform.
Data correspond to usage on the plateform after 2015. The current usage metrics is available 48-96 hours after online publication and is updated daily on week days.
Initial download of the metrics may take a while.