Fig. 3
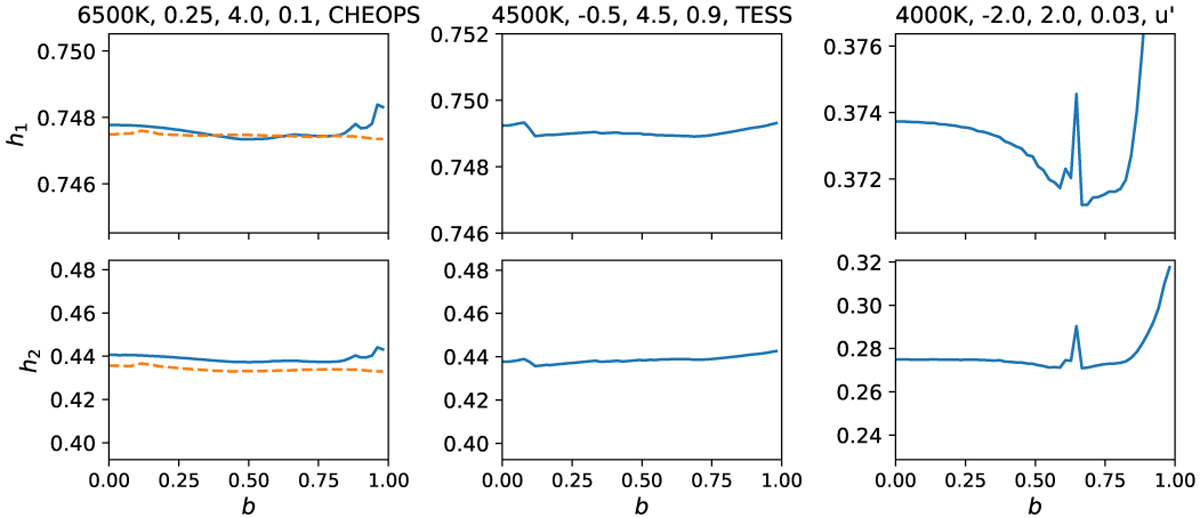
Optimized and transformed power-2 limb-darkening law parameters, h1 and h2 as a functionof impact parameter, b. The values of Teff, [Fe/H], logg and radius ratio, k, and the bandpass used for the simulation are noted in the title to each pair of panels. Note that the vertical scale on each axis is set by the median standard errors on h1,obs and h2,obs from Table A.1 (± 0.003 and ± 0.046, respectively). Also shown for the CHEOPS passband are the results for k = 0.9 (dashed line). The small spikes seen on the curves for the u′ passband are the result of numerical noise in the light curves at the few ppm level.
Current usage metrics show cumulative count of Article Views (full-text article views including HTML views, PDF and ePub downloads, according to the available data) and Abstracts Views on Vision4Press platform.
Data correspond to usage on the plateform after 2015. The current usage metrics is available 48-96 hours after online publication and is updated daily on week days.
Initial download of the metrics may take a while.