Fig. 1.
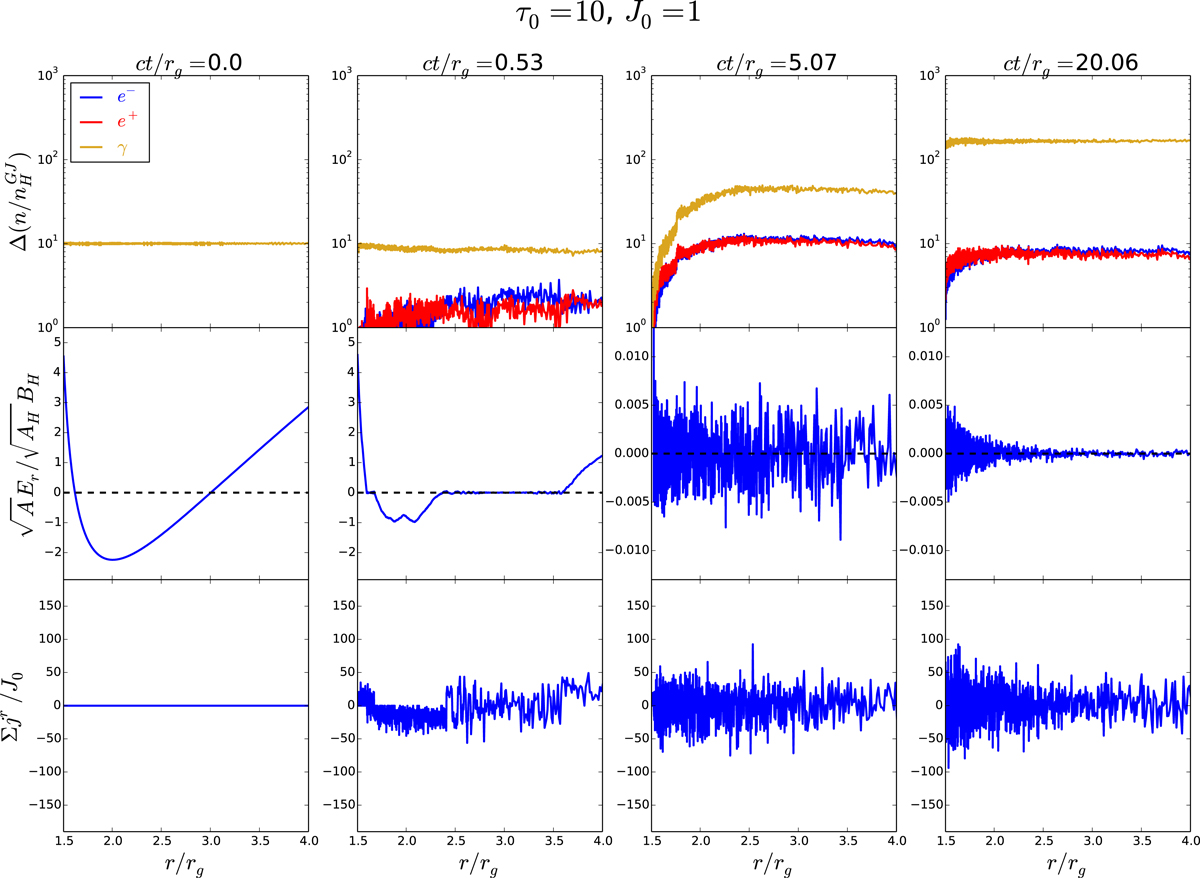
Snapshots from a typical simulation of spark gap dynamics. Shown are the pair and photon densities (upper panels), electric flux (middle panels), and radial electric current, Σjr, normalized by the global magnetospheric current J0. The leftmost panels delineate the initial state, at t = 0. The rightmost panels show the relaxed state, following the prompt discharge. We note the scale change on the vertical axis in the middle panels.
Current usage metrics show cumulative count of Article Views (full-text article views including HTML views, PDF and ePub downloads, according to the available data) and Abstracts Views on Vision4Press platform.
Data correspond to usage on the plateform after 2015. The current usage metrics is available 48-96 hours after online publication and is updated daily on week days.
Initial download of the metrics may take a while.