Fig. 16
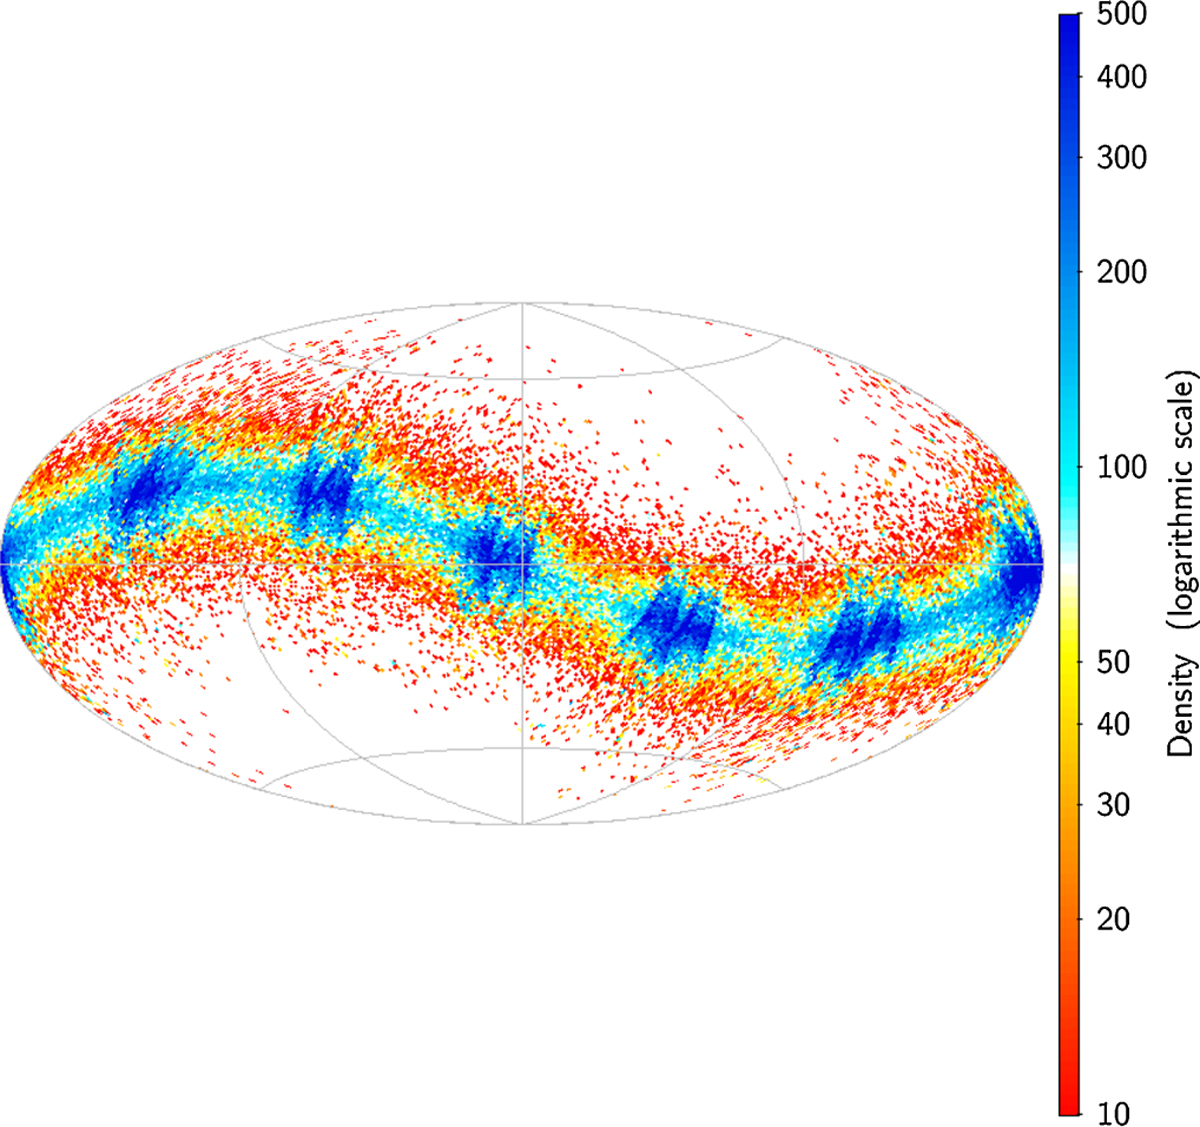
Sky distribution (equatorial coordinates) of the 2 005 683 observations for the 14 124 asteroid in the validation sample. This sky map use an Aitoff projection in equatorial (ICRS) coordinates with α = δ = 0 at the centre, north up, and α increasing from right to left. The observation density is higher in blue areas. The pattern in ecliptic longitude is a consequenceof the Gaia scanning law over a small fraction of the five-year nominal mission.
Current usage metrics show cumulative count of Article Views (full-text article views including HTML views, PDF and ePub downloads, according to the available data) and Abstracts Views on Vision4Press platform.
Data correspond to usage on the plateform after 2015. The current usage metrics is available 48-96 hours after online publication and is updated daily on week days.
Initial download of the metrics may take a while.