Fig. C.2.
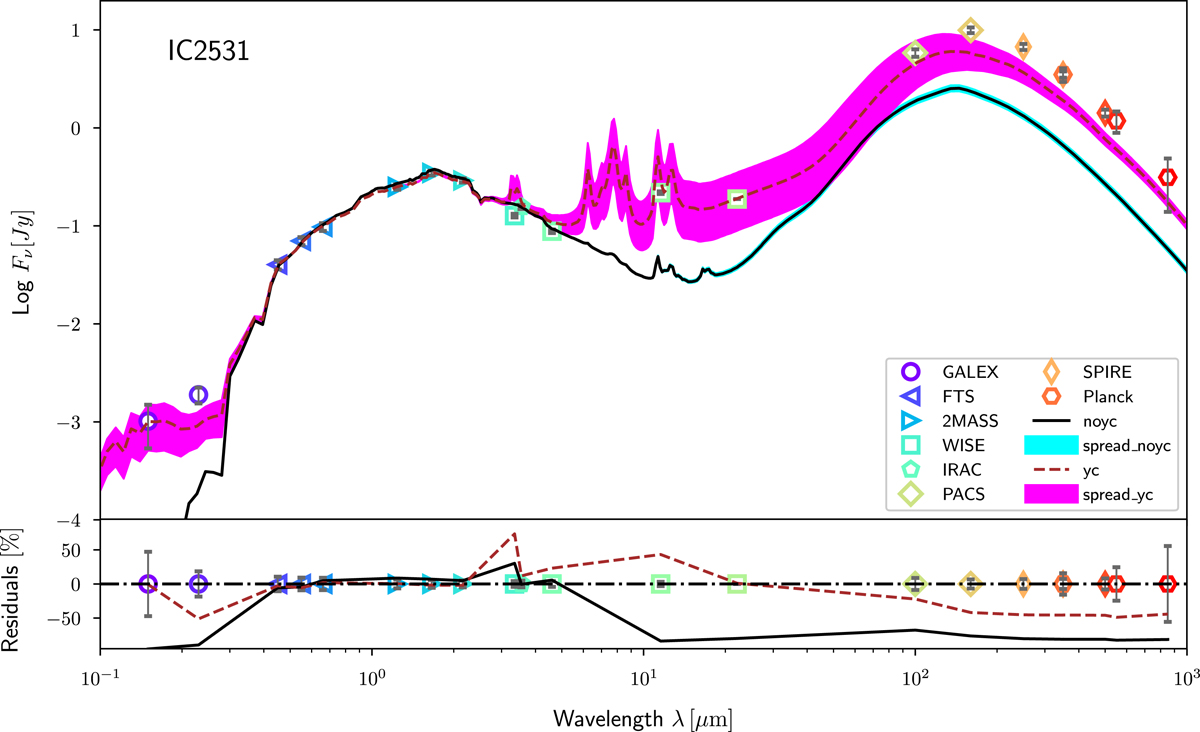
SEDs of IC 2531 with the THEMIS dust mixture. The coloured markers with error bars correspond to the flux densities listed in Table 2. The bottom panel below the SEDs shows the relative residuals between the observed SEDs and the models. The black line and the cyan spread correspond to the initial model (without a young stellar component, denoted as “noyc” and “spread_noyc”, respectively), the brown line and the magenta spread refer to the model with an additional young stellar component (denoted as “yc” and “spread_yc”, respectively). The spreads are plotted for the corresponding models within one error bar of the best oligochromatic fitting model parameters.
Current usage metrics show cumulative count of Article Views (full-text article views including HTML views, PDF and ePub downloads, according to the available data) and Abstracts Views on Vision4Press platform.
Data correspond to usage on the plateform after 2015. The current usage metrics is available 48-96 hours after online publication and is updated daily on week days.
Initial download of the metrics may take a while.