Open Access
Fig. 6
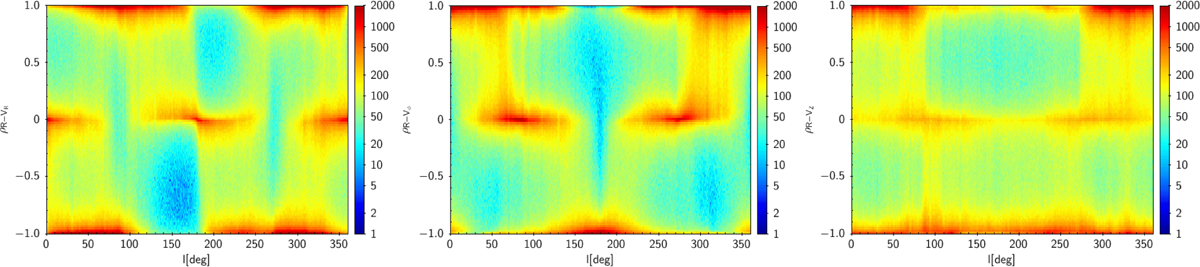
Correlations in the main sample between the components of the Galactic velocity and the Galactic radius (R) as a function of longitude. The colour scale indicates the number of stars per bins of [0.5, 0.02].
Current usage metrics show cumulative count of Article Views (full-text article views including HTML views, PDF and ePub downloads, according to the available data) and Abstracts Views on Vision4Press platform.
Data correspond to usage on the plateform after 2015. The current usage metrics is available 48-96 hours after online publication and is updated daily on week days.
Initial download of the metrics may take a while.