Fig. 5
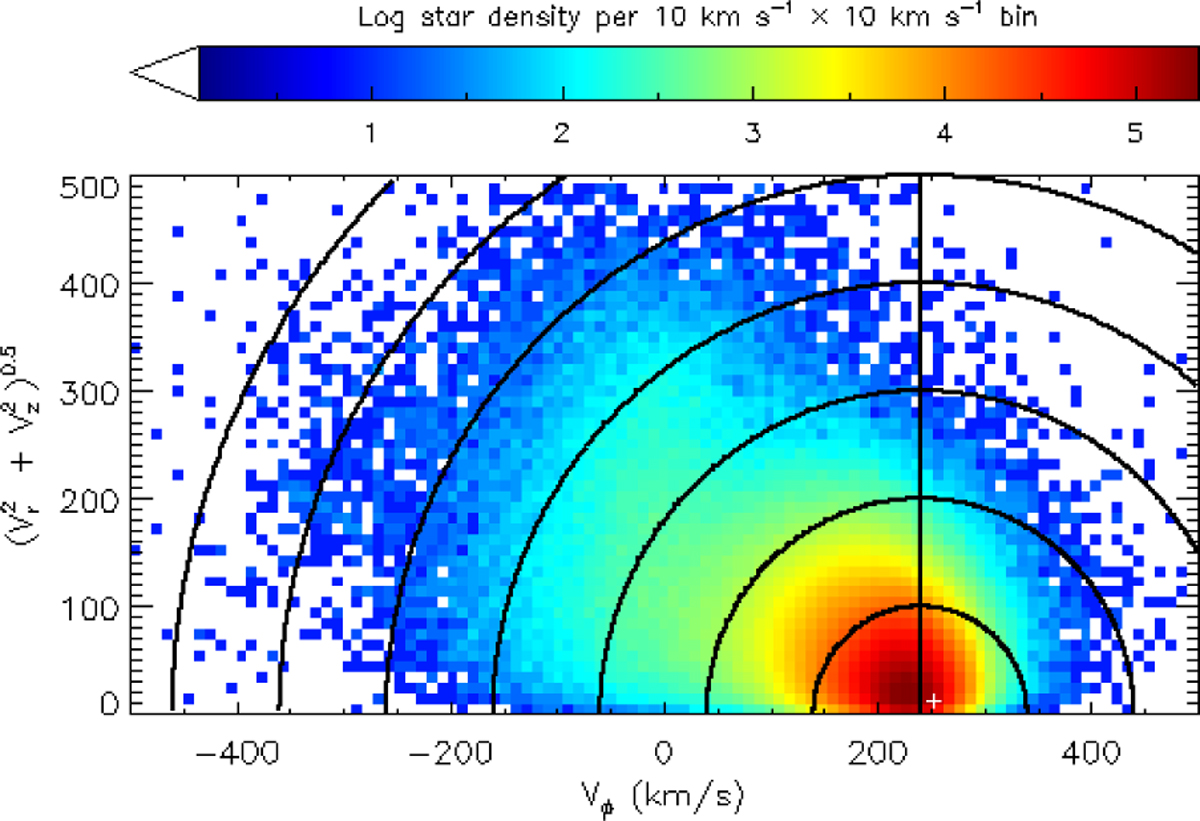
Toomre diagram of the main sample. The vertical line crosses the LSR at (V R, V ϕ,V Z) = (0, 240, 0) km s-1. The white dot is the peculiar velocity of the Sun: (V R, V ϕ,V Z) = (11.10, 252.24, 7.25) km s-1. The concentric circles show the total peculiar velocity, centred on the LSR. The traditional use of the Toomre diagram to classify stars into stellar populations is complicated by the great range of the Galactic radius of the sample (Fig. 3) and the possibility that both the mean V ϕ of the thin disc and the V ϕ lag between the thin and thick disc may vary with Galactic radius. Nevertheless, it shows that the sample is dominated by the thin disc. In the solar neighbourhood, the thin disc has an azimuthal velocity close to the LSR, and the thick disc lags behind by a few tens of km s-1.
Current usage metrics show cumulative count of Article Views (full-text article views including HTML views, PDF and ePub downloads, according to the available data) and Abstracts Views on Vision4Press platform.
Data correspond to usage on the plateform after 2015. The current usage metrics is available 48-96 hours after online publication and is updated daily on week days.
Initial download of the metrics may take a while.