Fig. C.6
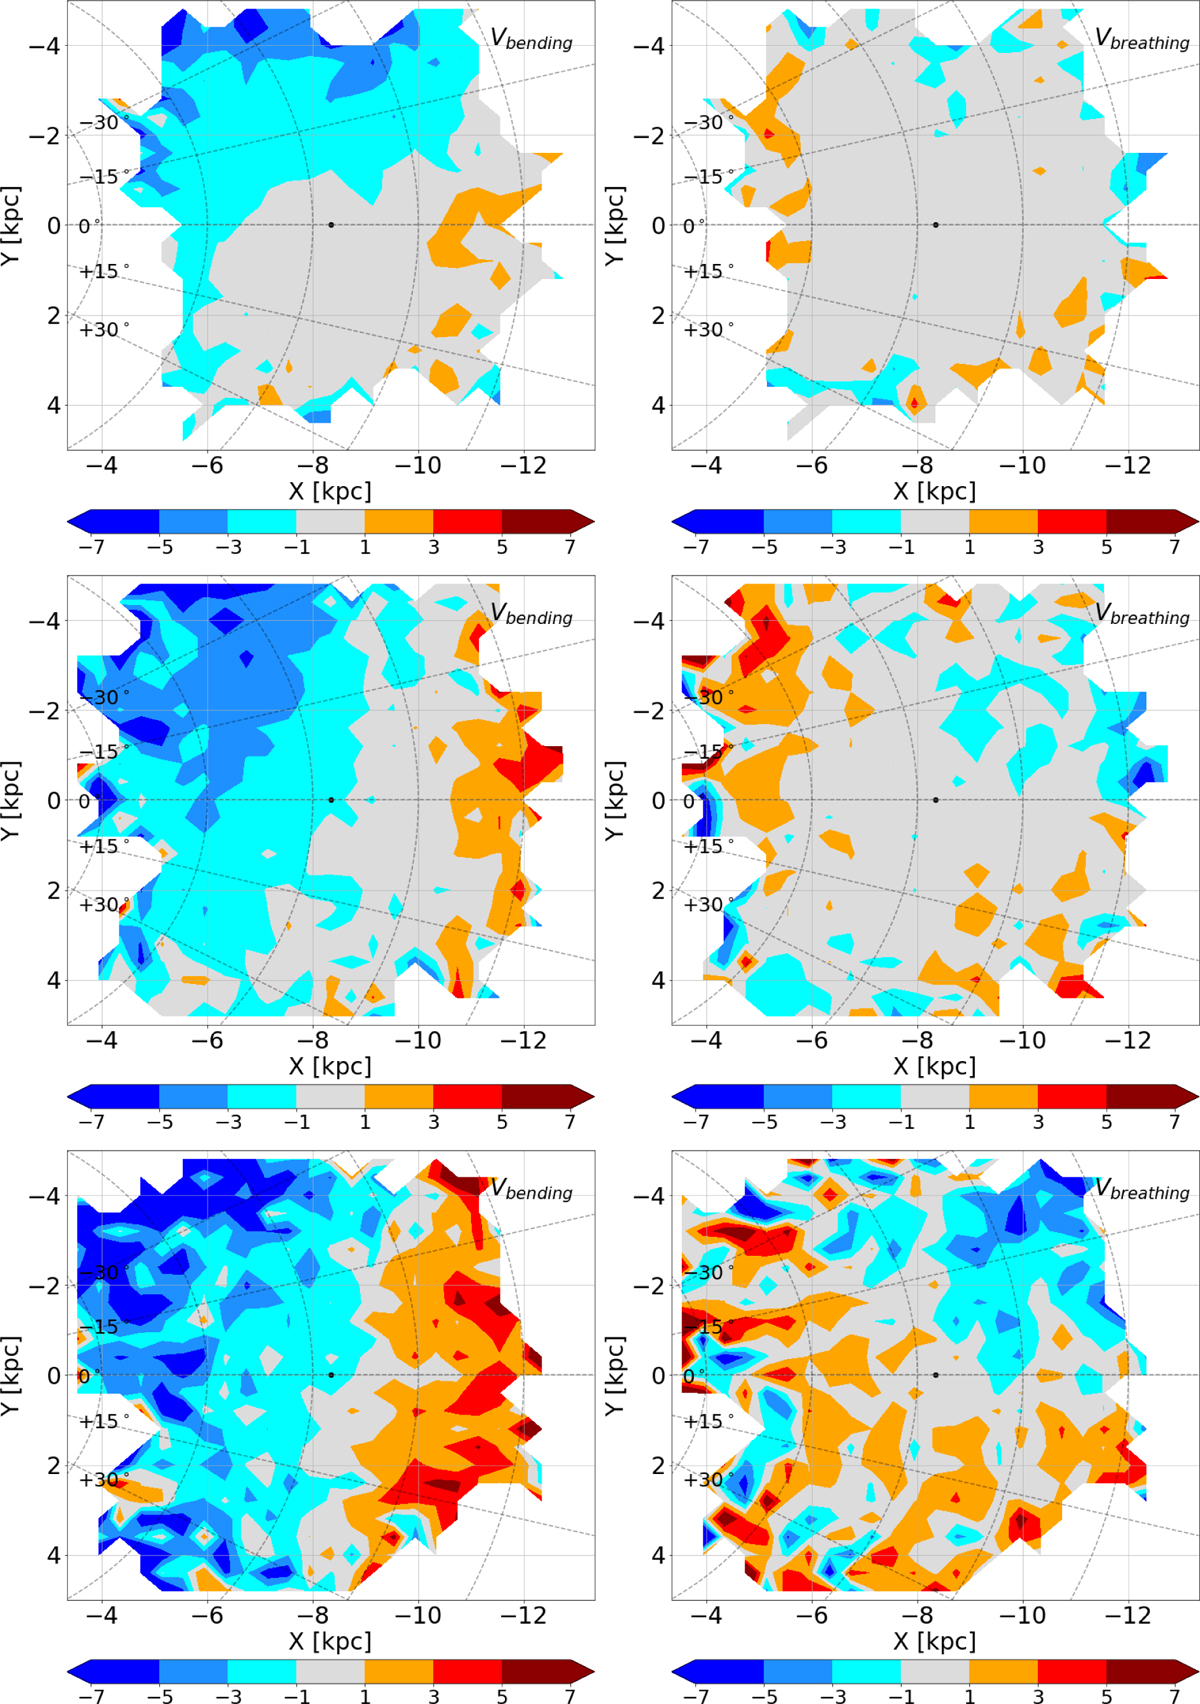
Same as Fig. C.1 for the bending (left) and breathing (right) velocities. Here the disc has been divided into three groups of symmetric layers. The distance to the Galactic mid-plane increases from top to bottom: [−400, 0] and [0, 400] pc (top), [−800, −400] and [400, 800] pc (middle), [−1200, −800] and [800, 1200] pc (bottom). The bending and breathing velocities have been calculated using larger (X, Y) cells than inthe other maps of this appendix, i.e. 400 pc by 400 pc instead of 200 pc by 200 pc.
Current usage metrics show cumulative count of Article Views (full-text article views including HTML views, PDF and ePub downloads, according to the available data) and Abstracts Views on Vision4Press platform.
Data correspond to usage on the plateform after 2015. The current usage metrics is available 48-96 hours after online publication and is updated daily on week days.
Initial download of the metrics may take a while.