Fig. C.2
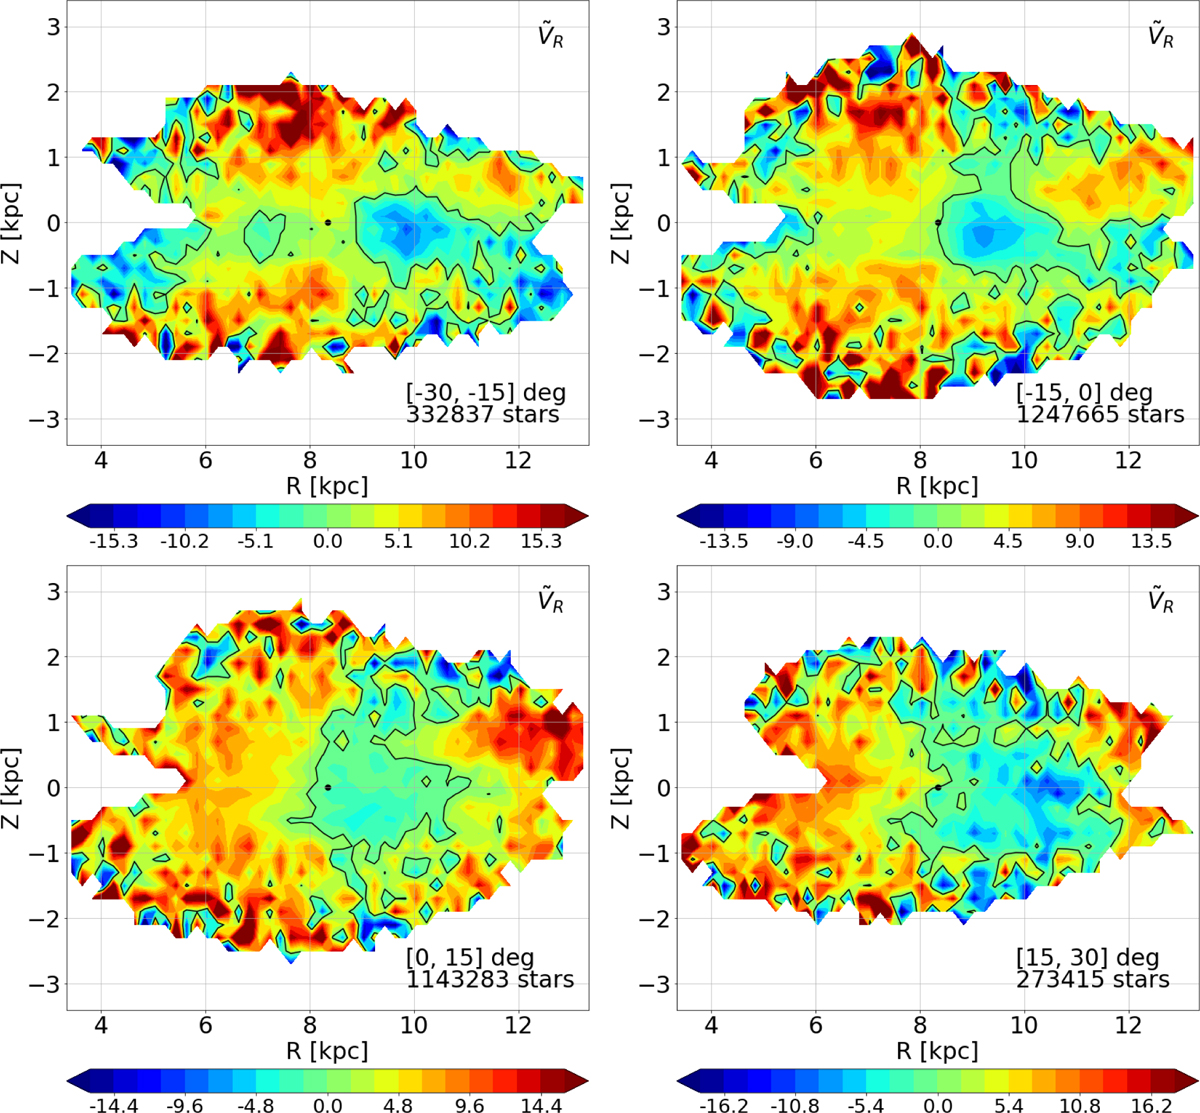
Mosaic of edge-on maps of the median radial velocity, ṼR, of thegiant sample. Each map corresponds to a slice of 15 degrees in azimuth: [−30, −15] (top left), [−15, 0] (top right), [0, +15] (bottom left), and [+15, +30] degrees (bottom right). The Sun is represented by a black dot at X = −8.34 kpc and Y = 0 kpc. The Galactic centre is located on the left side. The iso-velocity contours Ṽ R = 0 km s-1 are pointed out as black lines. The numbers of stars used to produce the maps are given in the lower left corners.
Current usage metrics show cumulative count of Article Views (full-text article views including HTML views, PDF and ePub downloads, according to the available data) and Abstracts Views on Vision4Press platform.
Data correspond to usage on the plateform after 2015. The current usage metrics is available 48-96 hours after online publication and is updated daily on week days.
Initial download of the metrics may take a while.