Fig. 23
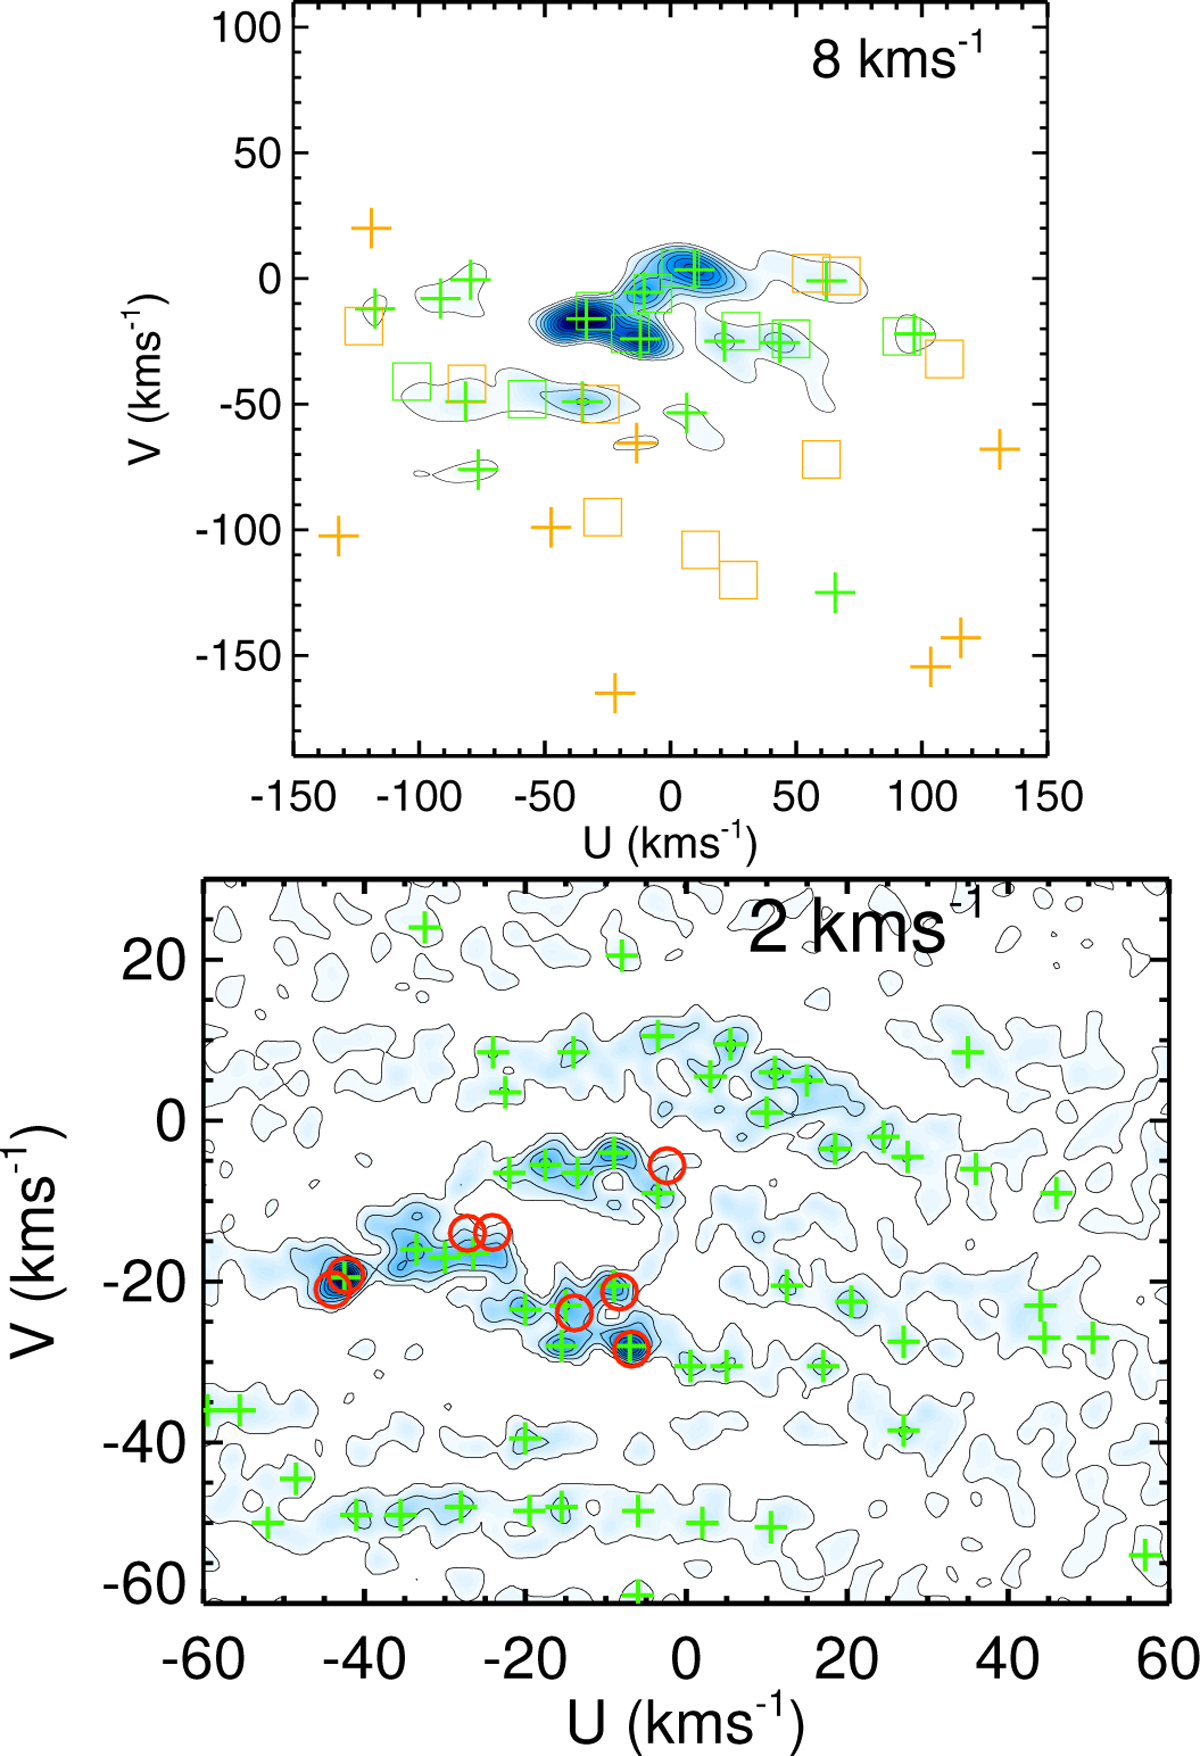
Wavelet transform coefficients of the velocity plane in the solar neighbourhood showing the substructures at different scales. Top panel: scales of around 8 km s-1. The green and orange symbols mark peaks that are > 3σ and 2 −3σ significant, respectively, for DR2 (crosses) or for the RAVE sample (squares) from the study of (Antoja et al. 2012; their table 2). Bottom panel: scales of around 2 km s-1. The green crosses mark peaks that are >3σ significant. The red circles mark peaks for the velocity positions of nearby open clusters that are located at distances closer than 200 pc (see text). This panel shows a zoom-in on the central parts of the velocity plane.
Current usage metrics show cumulative count of Article Views (full-text article views including HTML views, PDF and ePub downloads, according to the available data) and Abstracts Views on Vision4Press platform.
Data correspond to usage on the plateform after 2015. The current usage metrics is available 48-96 hours after online publication and is updated daily on week days.
Initial download of the metrics may take a while.