Fig. 19
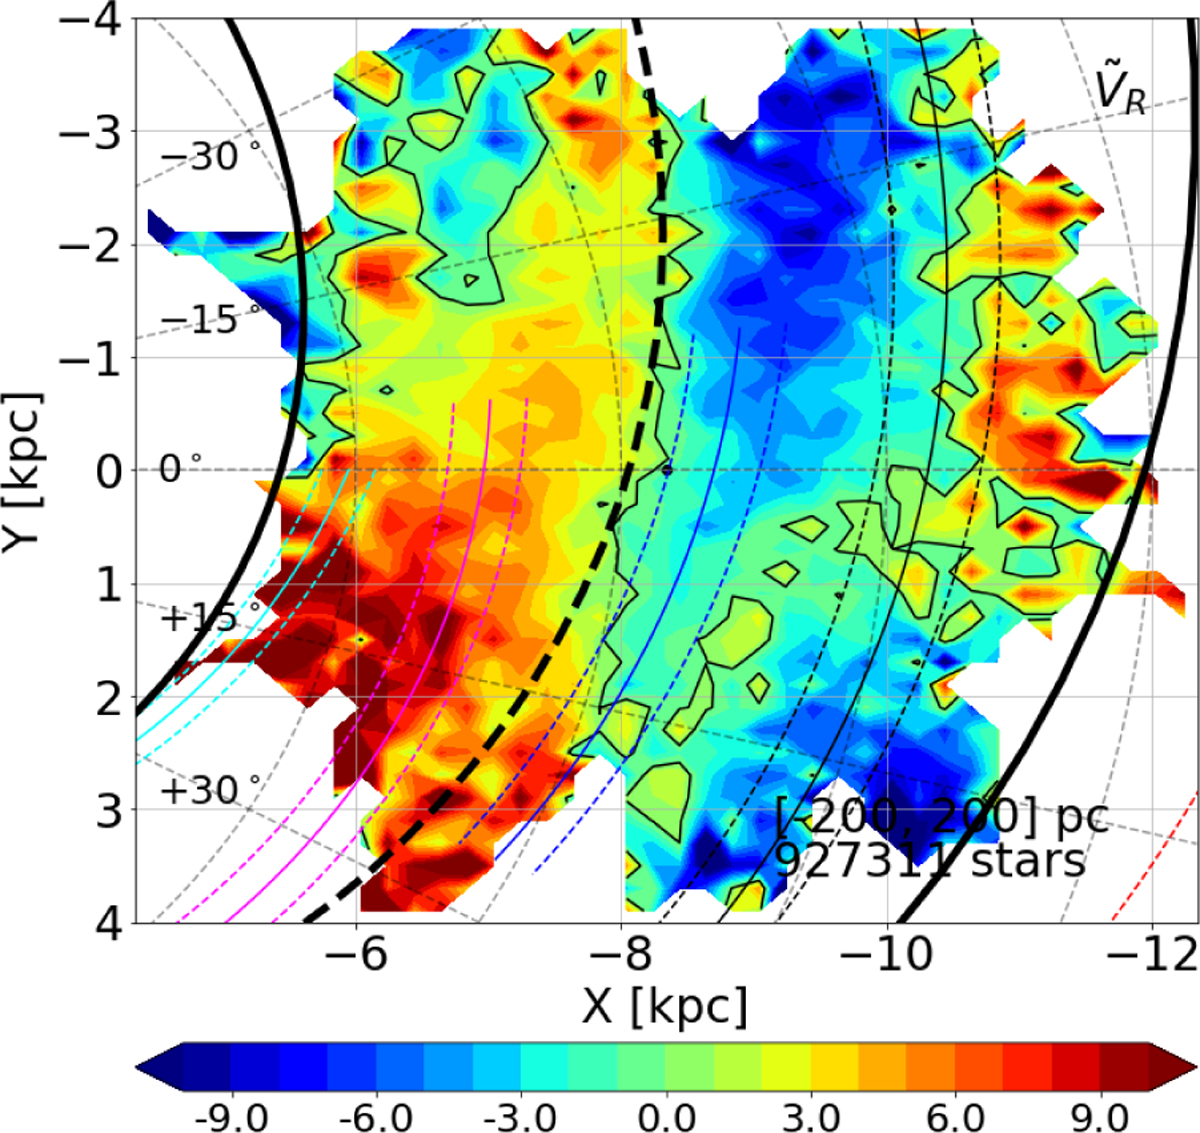
Face-on map of the median radial velocity (in km s-1) for the mid-plane layer ([−200, +200] pc), derived using the giant sample. The two-arm model of Drimmel (2000), adjusted on near infra-red data, is over-plotted as thick black lines. The thick dashed line highlights the locus of minimum density between the two arms. The spiral arms model of Reid et al. (2014) is also over-plotted, i.e. from the inner to the outer disc: Scutum (cyan), Sagittarius (magenta), Local Arm (blue), Perseus (black), and the Outer Arm (red).
Current usage metrics show cumulative count of Article Views (full-text article views including HTML views, PDF and ePub downloads, according to the available data) and Abstracts Views on Vision4Press platform.
Data correspond to usage on the plateform after 2015. The current usage metrics is available 48-96 hours after online publication and is updated daily on week days.
Initial download of the metrics may take a while.