Fig. 15
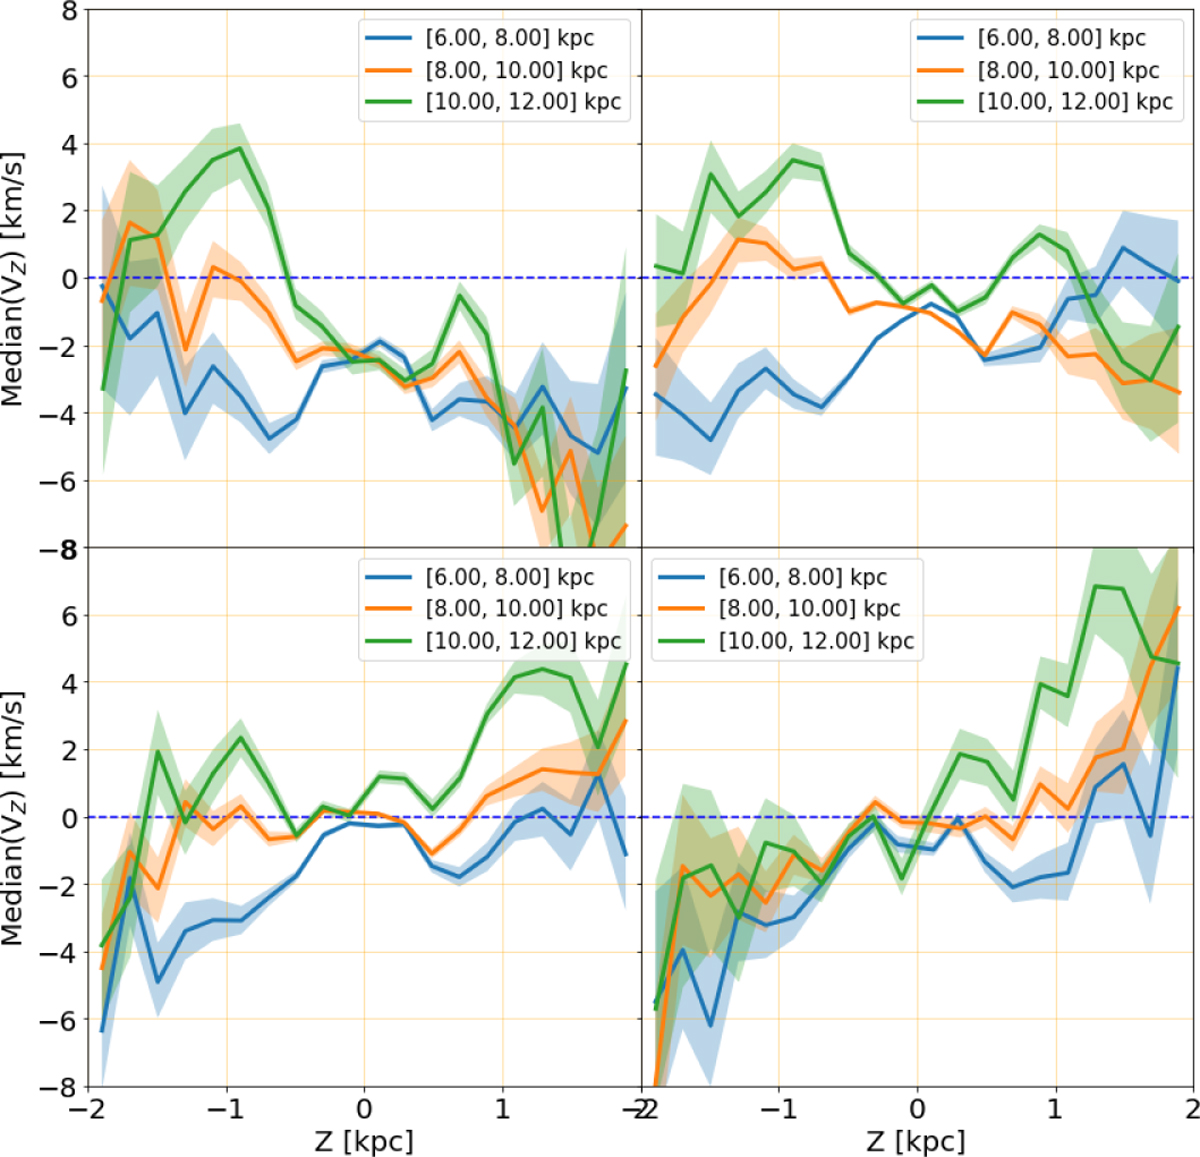
Median vertical velocities, ṼZ, of the giant sample as a function of height, Z, for four azimuth slices: [−30, −15] degrees (upper left panel), [−15, 0] degrees (upper right panel), [0, +15] degrees (lower left panel), and [+15, +30] degrees (lower right panel). The curves correspond to different ranges of galactic radius: R ∈ [6, 8] kpc (blue), [8, 10] kpc (orange), and [10, 12] kpc (green). The shaded areas represent the ± 1−σ uncertainties on the median vertical velocities.
Current usage metrics show cumulative count of Article Views (full-text article views including HTML views, PDF and ePub downloads, according to the available data) and Abstracts Views on Vision4Press platform.
Data correspond to usage on the plateform after 2015. The current usage metrics is available 48-96 hours after online publication and is updated daily on week days.
Initial download of the metrics may take a while.