Fig. 4
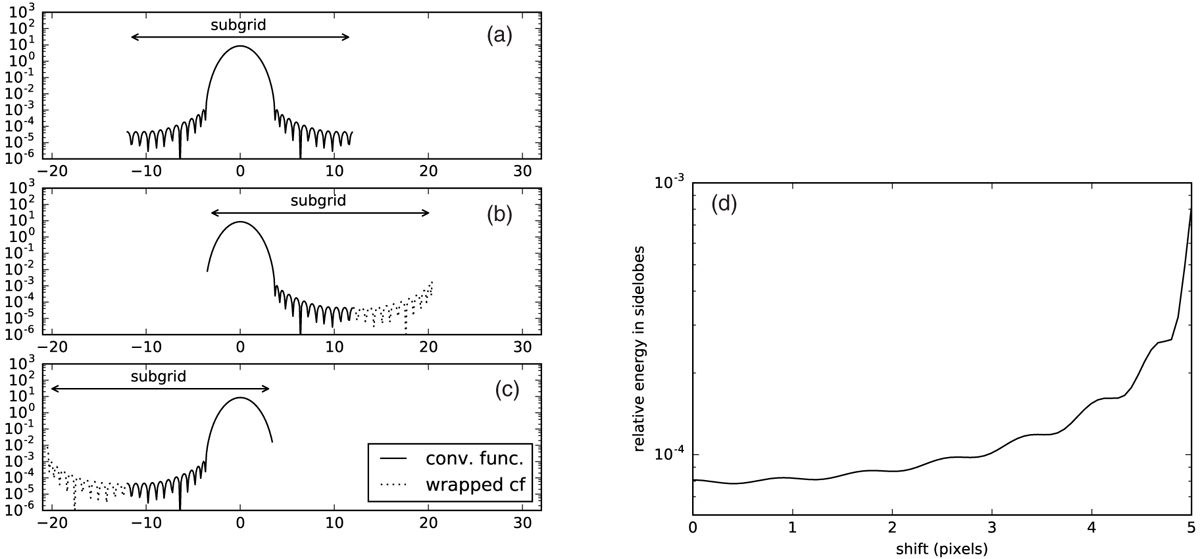
Panels a–c: effective convolution function for samples at different positions within the sub-grid; panel a: sample at the center ofthe sub-grid; panel b: sample at the leftmost position within the sub-grid before the main lobe wraps around; panel c: sample at the rightmost position within the sub-grid before the main lobe wraps around. Panel d: gridding error as a function of position of the sample within the sub-grid. Close to the center of the sub-grid the error changes little with position. The error increases quickly with distance from the center immediately before the maximum distance is reached.
Current usage metrics show cumulative count of Article Views (full-text article views including HTML views, PDF and ePub downloads, according to the available data) and Abstracts Views on Vision4Press platform.
Data correspond to usage on the plateform after 2015. The current usage metrics is available 48-96 hours after online publication and is updated daily on week days.
Initial download of the metrics may take a while.