Free Access
Fig. 3
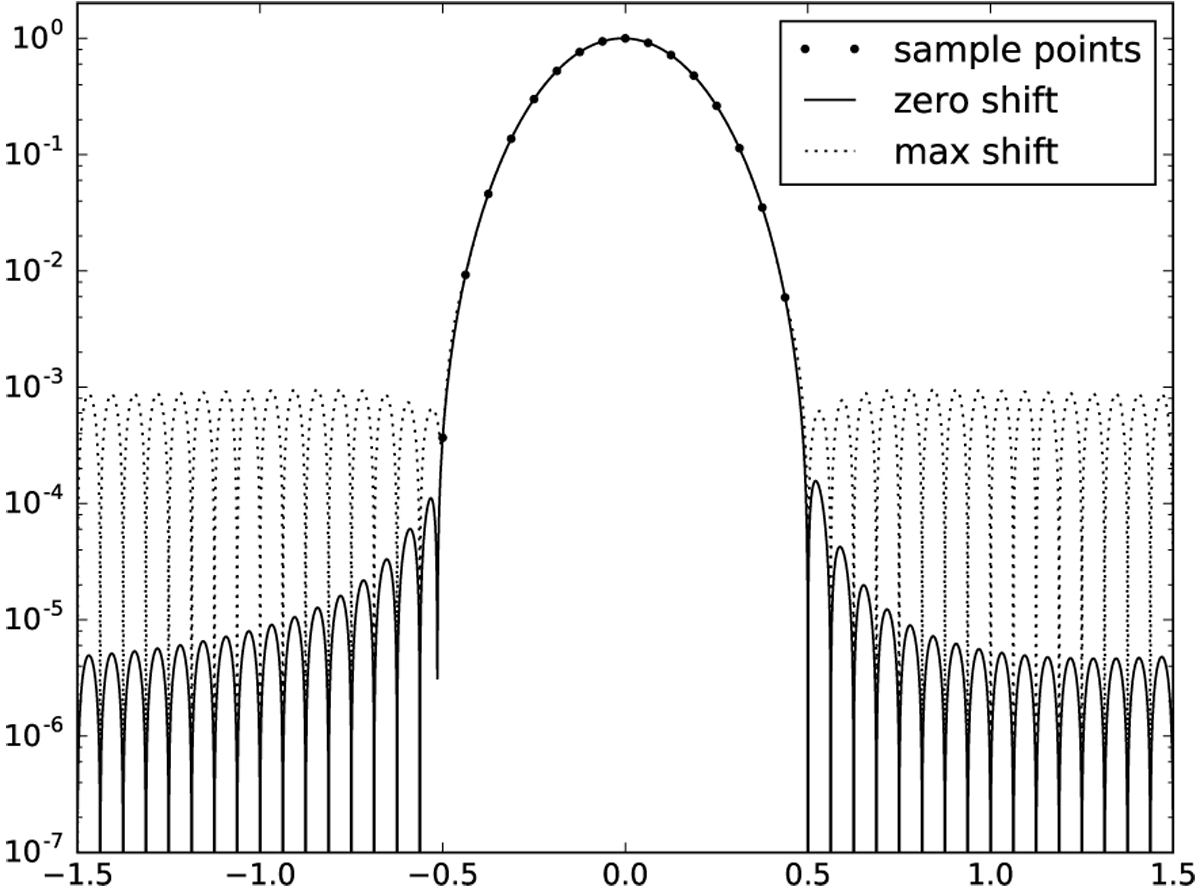
Effective window depending on the position of the sample within the sub-grid. The lowest side lobes are for a sample in the center of the sub-grid. The higher side lobes for samples close to the edge are caused by the phase gradient corresponding to a shift away from the center.
Current usage metrics show cumulative count of Article Views (full-text article views including HTML views, PDF and ePub downloads, according to the available data) and Abstracts Views on Vision4Press platform.
Data correspond to usage on the plateform after 2015. The current usage metrics is available 48-96 hours after online publication and is updated daily on week days.
Initial download of the metrics may take a while.