Fig. 2
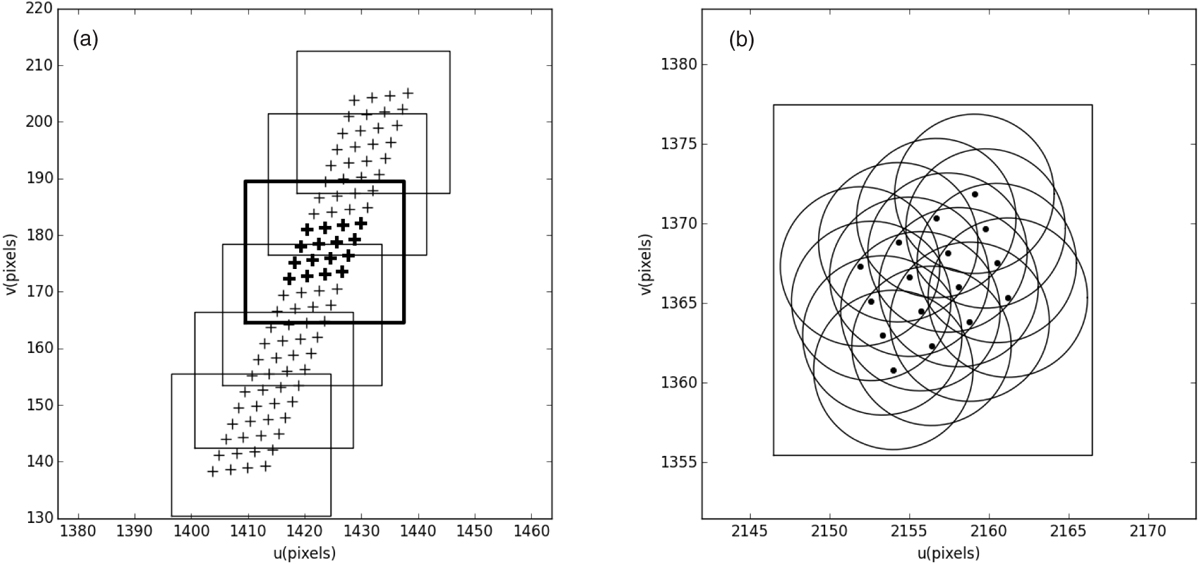
Panel a: track in uv domain fora single baseline and multiple channels. The boxes indicate the position of the subgrids. The bold box corresponds to the bold samples. Panel b: single subgrid (box) encompassing all affected pixels in the uv grid. The support of the convolution function is indicated by the circles around the samples.
Current usage metrics show cumulative count of Article Views (full-text article views including HTML views, PDF and ePub downloads, according to the available data) and Abstracts Views on Vision4Press platform.
Data correspond to usage on the plateform after 2015. The current usage metrics is available 48-96 hours after online publication and is updated daily on week days.
Initial download of the metrics may take a while.