Fig. A.3.
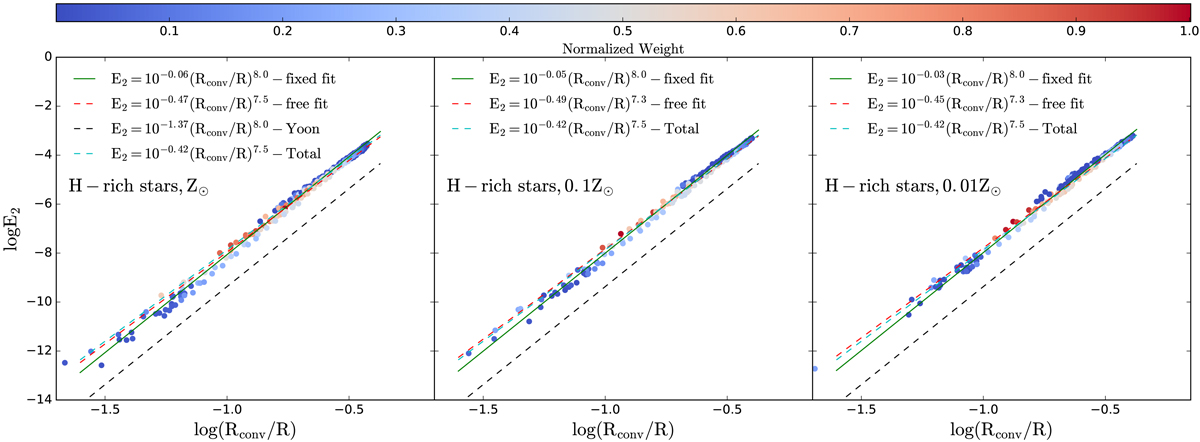
E2 as a function of Rconv/R for H-rich stars at different metallicities. Black dotted line corresponds to the formula from Yoon et al. (2010); red dashed line refers to the free fitting; green solid line refers to the fitting data with the fixed exponent of Rconv/R = 8.0, cyan dotted line refers to the fitting data with all three different metallicities. Different color bar points correspond to the weights of E2 defined in Eq. (A.5). Left panel: Z⊙, middle panel: 0.1 Z⊙, right panel: 0.01 Z⊙.
Current usage metrics show cumulative count of Article Views (full-text article views including HTML views, PDF and ePub downloads, according to the available data) and Abstracts Views on Vision4Press platform.
Data correspond to usage on the plateform after 2015. The current usage metrics is available 48-96 hours after online publication and is updated daily on week days.
Initial download of the metrics may take a while.