Fig. 9
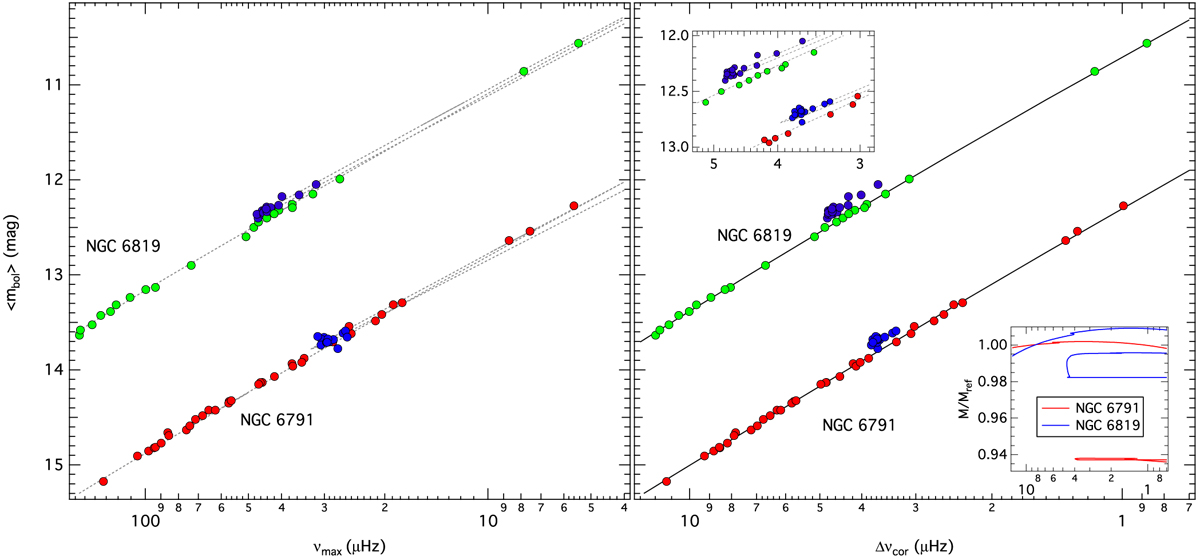
Average apparent bolometric magnitude as a function of νmax (left panel) and Δνcor (right panel) for our sample of RGB (red and green dots) and RC (blue dots) stars in NGC 6791 and NGC 6819, respectively. The dotted lines in the left panel (and top inset in the right panel) correspond to BaSTI isochrones (Z = 0.03 and 8.0 Gyr for NGC 6791 and Z = 0.02 and 2.5 Gyr for NGC 6819) arbitrarily shifted to match the observations. The loops in the isochrones correspond to the various phases of the RGB evolution. Solid lines in the right panel indicate polynomial fits to the RGB stars. The bottom inset gives the mass of the BaSTI isochrones normalised to the mass at νmax =100 μHz.
Current usage metrics show cumulative count of Article Views (full-text article views including HTML views, PDF and ePub downloads, according to the available data) and Abstracts Views on Vision4Press platform.
Data correspond to usage on the plateform after 2015. The current usage metrics is available 48-96 hours after online publication and is updated daily on week days.
Initial download of the metrics may take a while.