Fig. 8
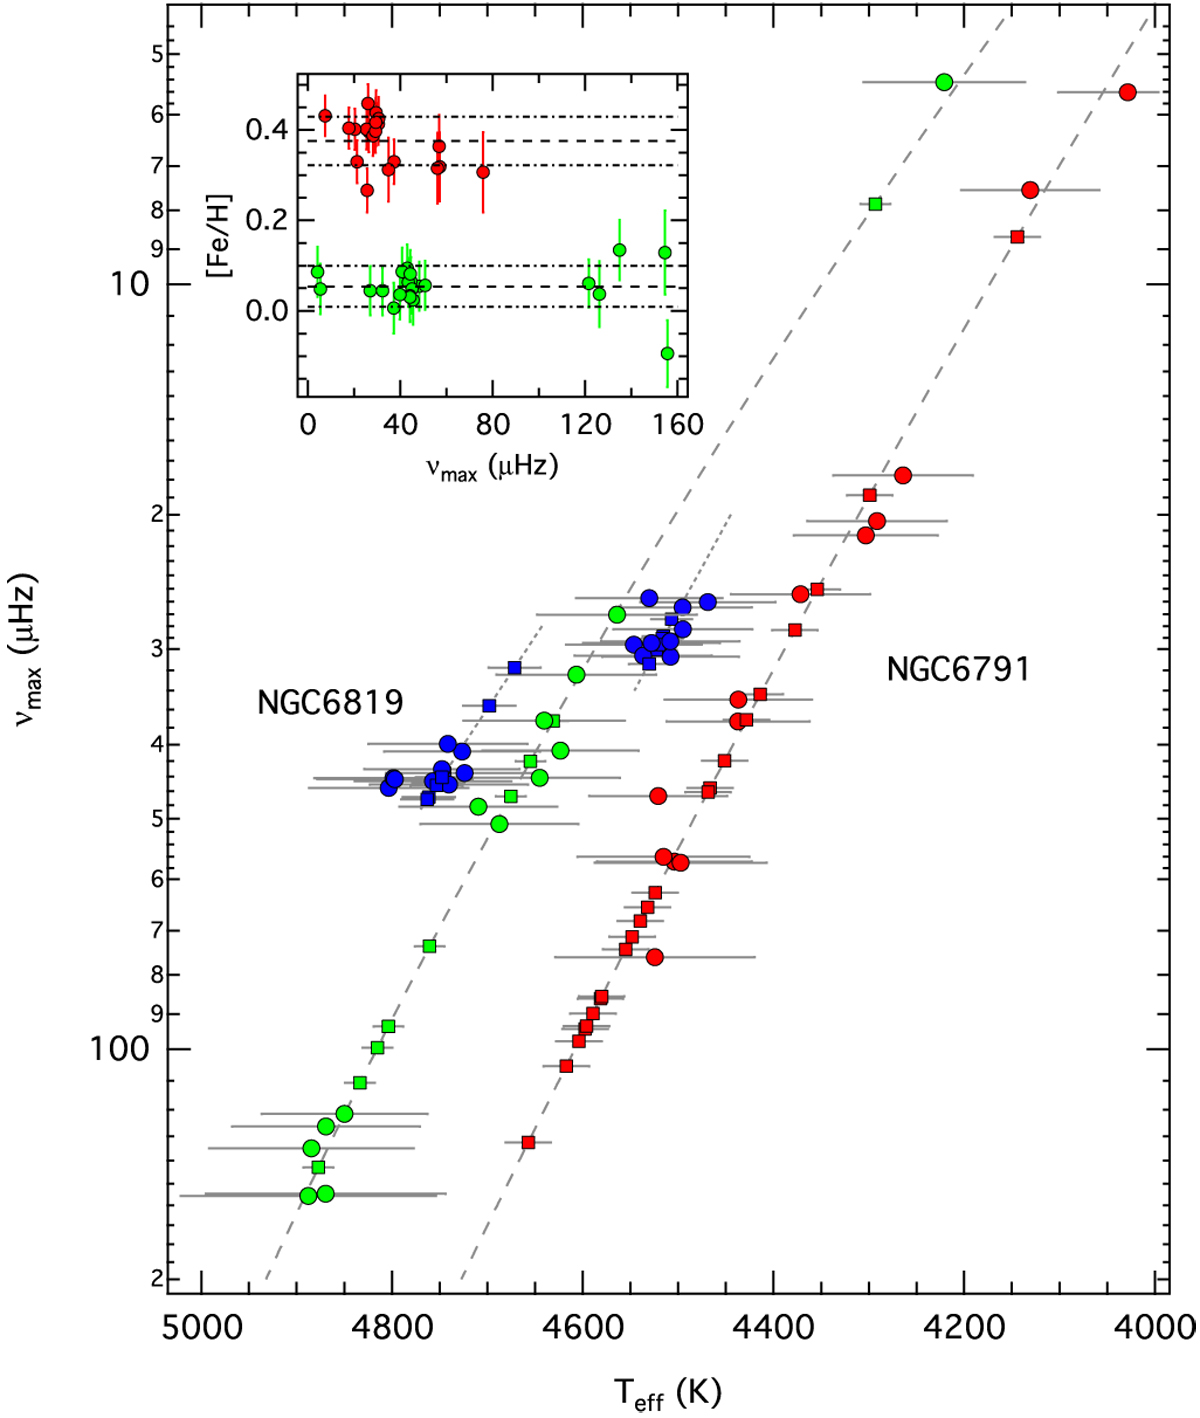
Peak frequency vs. effective temperature for our sample of RGB (red and green symbols) and RC (bluesymbols) stars in NGC6791 and NGC6819, respectively. Circles and squares indicate stars with theeffective temperature taken from the APOKASC catalogue and derived from polynomial fits (greydashed and dotted lines), respectively. Horizontal grey lines represent the uncertainties in Teff. The inset shows the metallicity measurements from the APOKASC catalogue along with the average values (dashed lines) and their uncertainties (dashed-dotted lines).
Current usage metrics show cumulative count of Article Views (full-text article views including HTML views, PDF and ePub downloads, according to the available data) and Abstracts Views on Vision4Press platform.
Data correspond to usage on the plateform after 2015. The current usage metrics is available 48-96 hours after online publication and is updated daily on week days.
Initial download of the metrics may take a while.